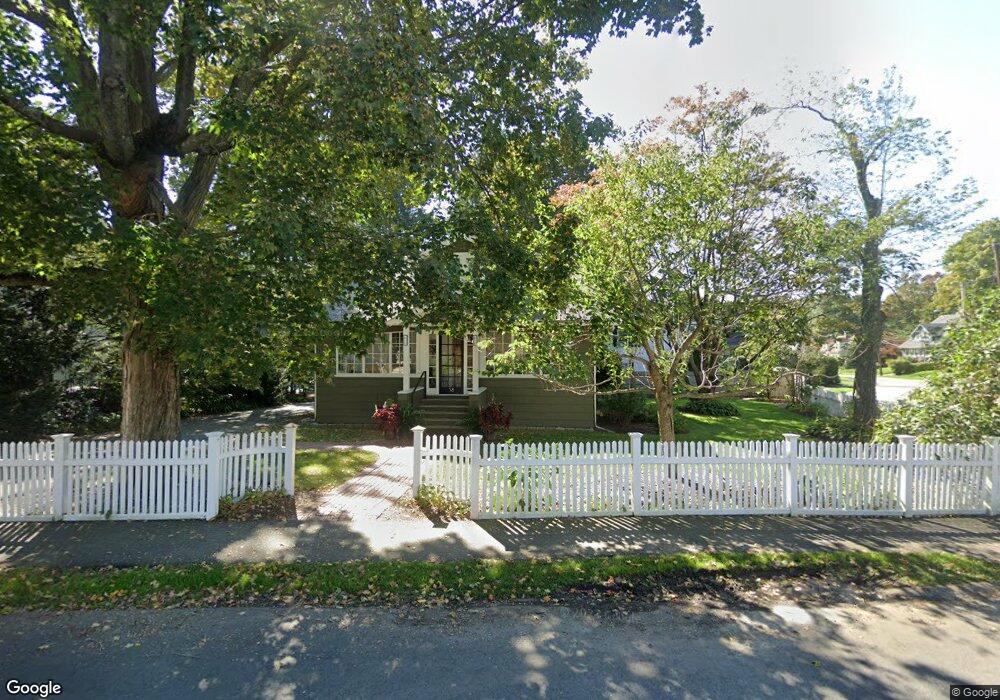
58 Walnut St Needham, MA 02492
Estimated Value: $1,342,000 - $1,550,215
4
Beds
2
Baths
1,291
Sq Ft
$1,108/Sq Ft
Est. Value
About This Home
This home is located at 58 Walnut St, Needham, MA 02492 and is currently estimated at $1,430,554, approximately $1,108 per square foot. 58 Walnut St is a home located in Norfolk County with nearby schools including Newman Elementary School, High Rock Middle School, and Pollard Middle School.
Ownership History
Date
Name
Owned For
Owner Type
Purchase Details
Closed on
Mar 20, 2023
Sold by
Larsson Christer B and Korostoff Julie E
Bought by
Korostoff Julie E
Current Estimated Value
Create a Home Valuation Report for This Property
The Home Valuation Report is an in-depth analysis detailing your home's value as well as a comparison with similar homes in the area
Home Values in the Area
Average Home Value in this Area
Purchase History
| Date | Buyer | Sale Price | Title Company |
|---|---|---|---|
| Korostoff Julie E | -- | None Available | |
| Korostoff Julie E | -- | None Available |
Source: Public Records
Tax History
| Year | Tax Paid | Tax Assessment Tax Assessment Total Assessment is a certain percentage of the fair market value that is determined by local assessors to be the total taxable value of land and additions on the property. | Land | Improvement |
|---|---|---|---|---|
| 2025 | $13,253 | $1,250,300 | $722,500 | $527,800 |
| 2024 | $14,961 | $1,195,000 | $527,300 | $667,700 |
| 2023 | $15,189 | $1,164,800 | $527,300 | $637,500 |
| 2022 | $14,968 | $1,119,500 | $497,500 | $622,000 |
| 2021 | $14,587 | $1,119,500 | $497,500 | $622,000 |
| 2020 | $13,799 | $1,104,800 | $497,500 | $607,300 |
| 2019 | $12,482 | $1,007,400 | $452,400 | $555,000 |
| 2018 | $11,968 | $1,007,400 | $452,400 | $555,000 |
| 2017 | $11,299 | $950,300 | $452,400 | $497,900 |
| 2016 | $9,352 | $810,400 | $452,400 | $358,000 |
| 2015 | $9,149 | $810,400 | $452,400 | $358,000 |
| 2014 | $8,824 | $758,100 | $411,400 | $346,700 |
Source: Public Records
Map
Nearby Homes
- 73 Maple St Unit 1
- 193 Garden St
- 620 High Rock St
- 52 Hancock Rd
- 95 Deerfield Rd
- 15 Jenna Cir
- 24 Deerfield Rd
- 233 Warren St
- 287 High Rock St
- 19 Highland Ct Unit 19
- 3 Hancock Rd
- 68 Pleasant St Unit 68
- 90 Norfolk St
- 47 Emerson Rd
- 26 Gordon Rd
- 1011 Webster St
- 189 Bridle Trail Rd
- 40 Otis St Unit L
- 100 Rosemary Way Unit 129
- 638 Webster St