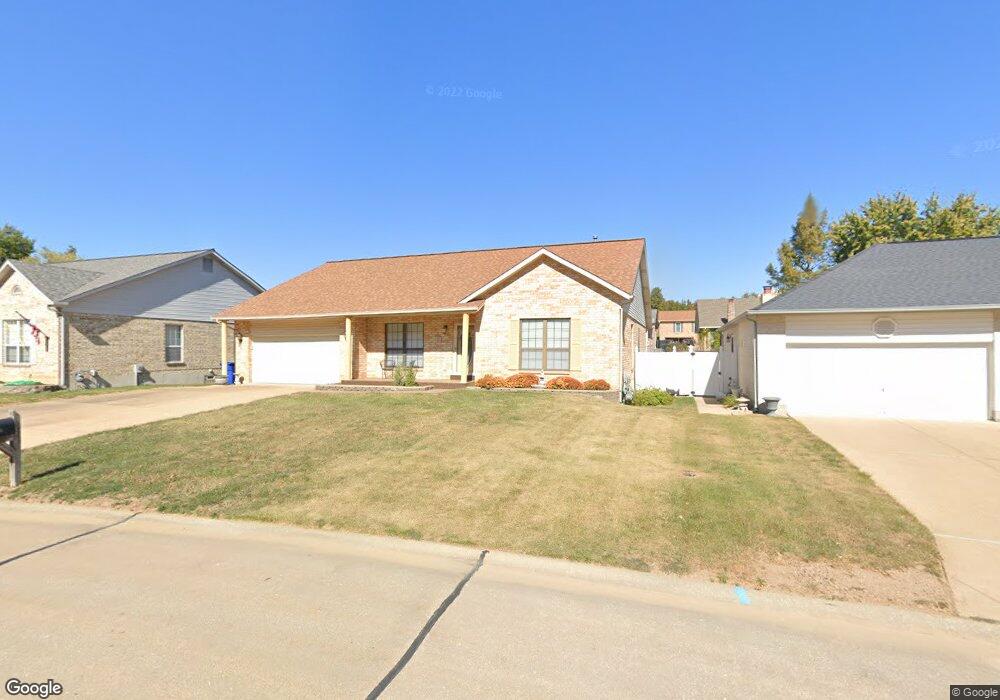
58 Wampler Dr Arnold, MO 63010
Estimated Value: $334,000 - $369,000
3
Beds
3
Baths
2,012
Sq Ft
$172/Sq Ft
Est. Value
About This Home
This home is located at 58 Wampler Dr, Arnold, MO 63010 and is currently estimated at $345,593, approximately $171 per square foot. 58 Wampler Dr is a home located in Jefferson County with nearby schools including Richard Simpson Elementary School, Seckman Middle School, and Seckman Senior High School.
Ownership History
Date
Name
Owned For
Owner Type
Purchase Details
Closed on
Apr 23, 2010
Sold by
Tsp Properties Llc
Bought by
Walkenbach Walter E
Current Estimated Value
Home Financials for this Owner
Home Financials are based on the most recent Mortgage that was taken out on this home.
Original Mortgage
$144,653
Outstanding Balance
$96,344
Interest Rate
5%
Mortgage Type
Future Advance Clause Open End Mortgage
Estimated Equity
$249,249
Purchase Details
Closed on
Apr 2, 2010
Sold by
Haller Jeffery Dean and Haller Richard Wayne
Bought by
Tsp Properties Llc
Home Financials for this Owner
Home Financials are based on the most recent Mortgage that was taken out on this home.
Original Mortgage
$144,653
Outstanding Balance
$96,344
Interest Rate
5%
Mortgage Type
Future Advance Clause Open End Mortgage
Estimated Equity
$249,249
Purchase Details
Closed on
Feb 10, 1999
Sold by
Haller Norman D and Haller Marie C
Bought by
Haller Norman D and Haller Marie C
Create a Home Valuation Report for This Property
The Home Valuation Report is an in-depth analysis detailing your home's value as well as a comparison with similar homes in the area
Home Values in the Area
Average Home Value in this Area
Purchase History
| Date | Buyer | Sale Price | Title Company |
|---|---|---|---|
| Walkenbach Walter E | -- | Tri | |
| Tsp Properties Llc | -- | Tri | |
| Haller Norman D | -- | -- |
Source: Public Records
Mortgage History
| Date | Status | Borrower | Loan Amount |
|---|---|---|---|
| Open | Tsp Properties Llc | $144,653 |
Source: Public Records
Tax History
| Year | Tax Paid | Tax Assessment Tax Assessment Total Assessment is a certain percentage of the fair market value that is determined by local assessors to be the total taxable value of land and additions on the property. | Land | Improvement |
|---|---|---|---|---|
| 2025 | $2,719 | $41,500 | $2,500 | $39,000 |
| 2024 | $2,719 | $38,100 | $2,500 | $35,600 |
| 2023 | $2,719 | $38,100 | $2,500 | $35,600 |
| 2022 | $2,700 | $38,100 | $2,500 | $35,600 |
| 2021 | $2,702 | $38,100 | $2,500 | $35,600 |
| 2020 | $2,545 | $34,000 | $2,100 | $31,900 |
| 2019 | $2,552 | $34,000 | $2,100 | $31,900 |
| 2018 | $2,534 | $34,000 | $2,100 | $31,900 |
| 2017 | $2,453 | $34,000 | $2,100 | $31,900 |
| 2016 | $2,089 | $31,200 | $2,100 | $29,100 |
| 2015 | $2,094 | $31,200 | $2,100 | $29,100 |
| 2013 | -- | $31,500 | $2,100 | $29,400 |
Source: Public Records
Map
Nearby Homes
- 80 Rex Aire Ct
- 2451 Elm Dr
- 2112 Santiago Dr
- 3001 Northern Lights Dr
- 3869 Crystal Wood Dr
- 3820 N Barrington Ct
- 3261 5 Oaks Dr
- 2149 Windemere Dr
- 3220 Quervo Ln
- 3224 Quervo Ln
- 3232 Quervo Ln
- 3 Aspen II at Bella Terra
- 3233 Quervo Ln
- 3 Aspen at Bella Terra
- 3 Sterling at Bella Terra
- 3 Ashford at Bella Terra
- 2 Royal II at Bella Terra
- 2 Berwick at Bella Terra
- 2 Maple at Bella Terra
- 4518 Bella Terra Dr
Your Personal Tour Guide
Ask me questions while you tour the home.