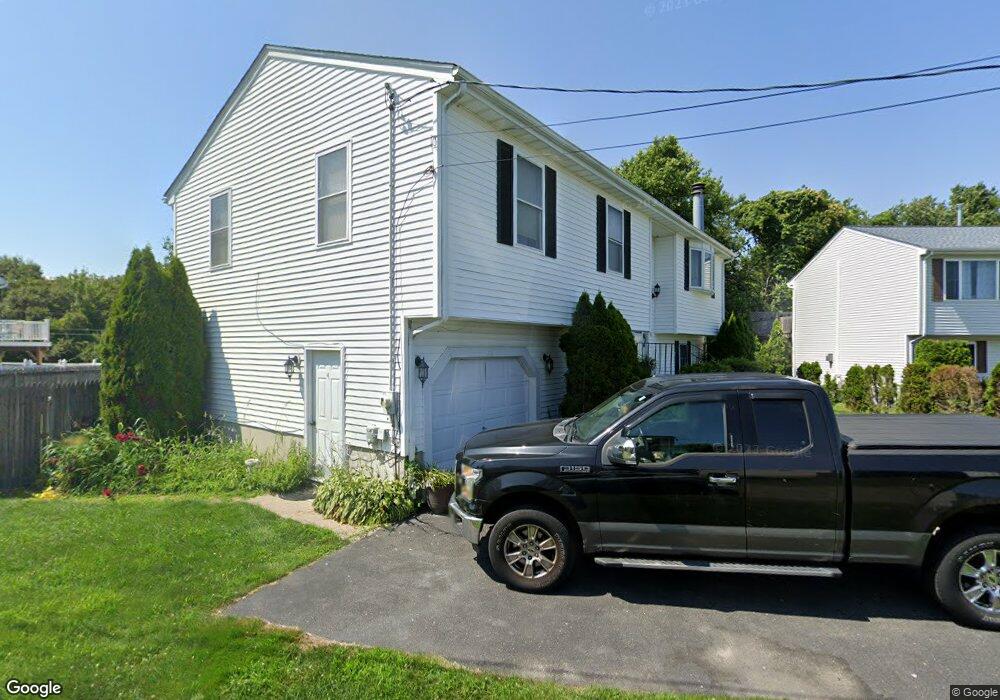
58 Watson Way Fall River, MA 02721
Maplewood NeighborhoodEstimated Value: $493,016 - $585,000
3
Beds
2
Baths
1,248
Sq Ft
$426/Sq Ft
Est. Value
About This Home
This home is located at 58 Watson Way, Fall River, MA 02721 and is currently estimated at $531,254, approximately $425 per square foot. 58 Watson Way is a home located in Bristol County with nearby schools including Henry Lord Community School, B M C Durfee High School, and Argosy Collegiate Charter School.
Ownership History
Date
Name
Owned For
Owner Type
Purchase Details
Closed on
Jul 31, 2003
Sold by
Correia Marelisa S and Correia Robert A
Bought by
Amorin Cristina B and Amorin Joao D
Current Estimated Value
Home Financials for this Owner
Home Financials are based on the most recent Mortgage that was taken out on this home.
Original Mortgage
$215,200
Outstanding Balance
$92,416
Interest Rate
5.28%
Mortgage Type
Purchase Money Mortgage
Estimated Equity
$438,838
Purchase Details
Closed on
Aug 16, 1996
Sold by
Well Built Homes Inc
Bought by
Correia Robert A and Correia Marelisa S
Home Financials for this Owner
Home Financials are based on the most recent Mortgage that was taken out on this home.
Original Mortgage
$114,000
Interest Rate
8.08%
Mortgage Type
Purchase Money Mortgage
Create a Home Valuation Report for This Property
The Home Valuation Report is an in-depth analysis detailing your home's value as well as a comparison with similar homes in the area
Home Values in the Area
Average Home Value in this Area
Purchase History
| Date | Buyer | Sale Price | Title Company |
|---|---|---|---|
| Amorin Cristina B | $269,900 | -- | |
| Correia Robert A | $120,500 | -- |
Source: Public Records
Mortgage History
| Date | Status | Borrower | Loan Amount |
|---|---|---|---|
| Open | Correia Robert A | $215,200 | |
| Previous Owner | Correia Robert A | $135,000 | |
| Previous Owner | Correia Robert A | $114,000 | |
| Previous Owner | Correia Robert A | $70,000 |
Source: Public Records
Tax History
| Year | Tax Paid | Tax Assessment Tax Assessment Total Assessment is a certain percentage of the fair market value that is determined by local assessors to be the total taxable value of land and additions on the property. | Land | Improvement |
|---|---|---|---|---|
| 2025 | $5,096 | $445,100 | $121,000 | $324,100 |
| 2024 | $4,551 | $396,100 | $118,600 | $277,500 |
| 2023 | $4,510 | $367,600 | $106,900 | $260,700 |
| 2022 | $3,948 | $312,800 | $100,800 | $212,000 |
| 2021 | $3,867 | $279,600 | $96,300 | $183,300 |
| 2020 | $3,764 | $260,500 | $91,900 | $168,600 |
| 2019 | $3,846 | $263,800 | $96,100 | $167,700 |
| 2018 | $3,519 | $240,700 | $96,800 | $143,900 |
| 2017 | $3,300 | $235,700 | $96,800 | $138,900 |
| 2016 | $3,035 | $222,700 | $99,700 | $123,000 |
| 2015 | $2,953 | $225,800 | $99,700 | $126,100 |
| 2014 | $2,841 | $225,800 | $99,700 | $126,100 |
Source: Public Records
Map
Nearby Homes
Your Personal Tour Guide
Ask me questions while you tour the home.