Estimated Value: $244,450 - $262,000
--
Bed
4
Baths
2,442
Sq Ft
$104/Sq Ft
Est. Value
About This Home
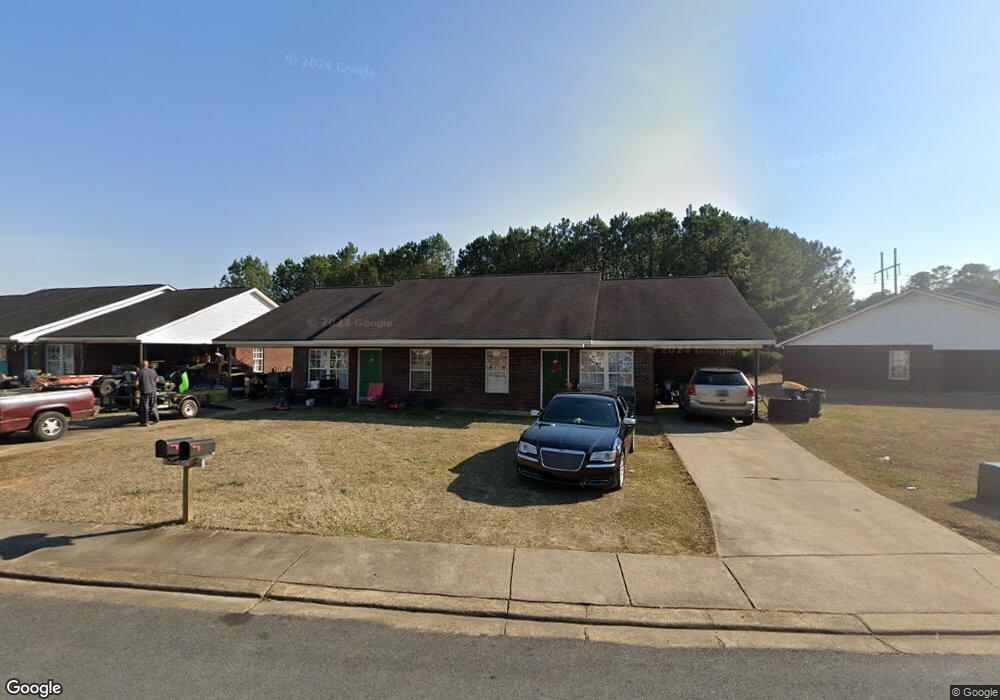
This home is located at 58 Wilma Dr NW Unit 58 & 60, Rome, GA 30165 and is currently estimated at $253,863, approximately $103 per square foot. 58 Wilma Dr NW Unit 58 & 60 is a home located in Floyd County with nearby schools including Rome High School.
Ownership History
Date
Name
Owned For
Owner Type
Purchase Details
Closed on
Oct 5, 2020
Sold by
Asy Properties Llc
Bought by
3Fox Holdings Llc
Current Estimated Value
Home Financials for this Owner
Home Financials are based on the most recent Mortgage that was taken out on this home.
Original Mortgage
$124,800
Outstanding Balance
$100,461
Interest Rate
2.9%
Mortgage Type
New Conventional
Estimated Equity
$153,402
Purchase Details
Closed on
Oct 19, 2018
Sold by
Martin Michael A
Bought by
Asy Properties Llc
Home Financials for this Owner
Home Financials are based on the most recent Mortgage that was taken out on this home.
Original Mortgage
$95,200
Interest Rate
4.6%
Mortgage Type
New Conventional
Purchase Details
Closed on
Jan 14, 2004
Sold by
Crew Investments Inc
Bought by
Martin Michael A
Purchase Details
Closed on
Mar 4, 2002
Bought by
Crew Investments Inc
Create a Home Valuation Report for This Property
The Home Valuation Report is an in-depth analysis detailing your home's value as well as a comparison with similar homes in the area
Home Values in the Area
Average Home Value in this Area
Purchase History
| Date | Buyer | Sale Price | Title Company |
|---|---|---|---|
| 3Fox Holdings Llc | $156,000 | -- | |
| Asy Properties Llc | $119,000 | -- | |
| Martin Michael A | $135,000 | -- | |
| Crew Investments Inc | -- | -- |
Source: Public Records
Mortgage History
| Date | Status | Borrower | Loan Amount |
|---|---|---|---|
| Open | 3Fox Holdings Llc | $124,800 | |
| Previous Owner | Asy Properties Llc | $95,200 |
Source: Public Records
Tax History Compared to Growth
Tax History
| Year | Tax Paid | Tax Assessment Tax Assessment Total Assessment is a certain percentage of the fair market value that is determined by local assessors to be the total taxable value of land and additions on the property. | Land | Improvement |
|---|---|---|---|---|
| 2024 | $3,552 | $92,617 | $14,784 | $77,833 |
| 2023 | $3,280 | $88,741 | $13,440 | $75,301 |
| 2022 | $3,034 | $83,152 | $12,800 | $70,352 |
| 2021 | $2,380 | $64,148 | $6,400 | $57,748 |
| 2020 | $1,784 | $47,679 | $6,400 | $41,279 |
| 2019 | $1,681 | $45,412 | $6,400 | $39,012 |
| 2018 | $1,520 | $41,055 | $6,400 | $34,655 |
| 2017 | $1,478 | $39,922 | $6,400 | $33,522 |
| 2016 | $1,457 | $39,240 | $6,400 | $32,840 |
| 2015 | $1,872 | $55,470 | $9,600 | $45,870 |
| 2014 | $1,872 | $55,470 | $9,600 | $45,870 |
Source: Public Records
Map
Nearby Homes
- 1 Addington Ct NW Unit B
- 233 Longmeadow Dr NW
- 13 Crosscreek Dr NW
- 46 Cornerstone Dr NW
- 1 Lindsey Terrace NW
- 104 Morgan Dr NW
- 320 Elliott Dr NW
- 8 Sagewood Dr NW
- 38 Boulder Dr NW
- 2614 Garden Lakes Blvd NW
- 2602 Lakeridge Cir NW
- 104 Sagewood Dr NW
- 24 Conway Place NW
- 23 Westwillow Ln NW
- 11 Pinestream Dr NW
- 25 Shoreline Dr NW
- 15 Alexander St
- 11 Simpson Dr NW
- 9 Prescott Ln NW
- 118 Melody Ln NW
- 58 Wilma Dr NW
- 58 Wilma Dr NW Unit 16,60
- 58 Wilma Dr NW Unit 60
- 58/60 Wilma Dr NW
- 60 Wilma Dr
- 62 Wilma Dr NW
- 48 Wilma Dr NW
- 61 Wilma Dr NW Unit 59
- 59 Wilma Dr NW
- 63 Wilma Dr NW Unit 65
- 63 Wilma Dr NW Unit 63 65
- 63 Wilma Dr NW
- 63 Wilma Dr NW Unit 63 65
- 66 Wilma Dr NW
- 65 Wilma Dr NW Unit 63 65
- 65 Wilma Dr NW
- 6 Tiger Ln NW
- 6 Tiger Ln NW Unit 40
- 57 Wilma Dr
- 38 Wilma Dr NW