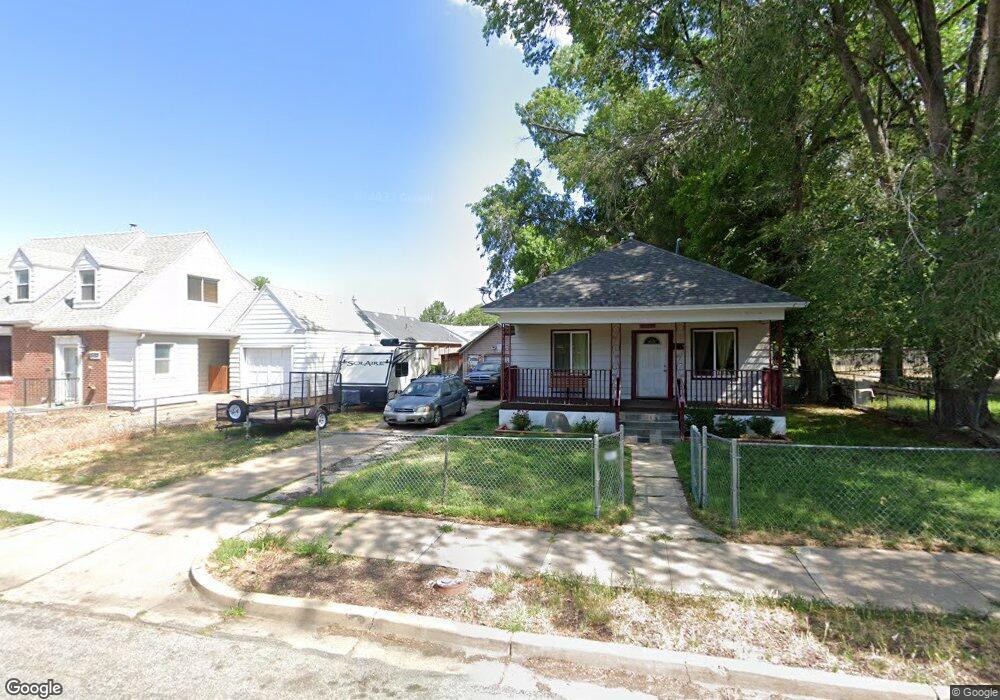
580 10th St Ogden, UT 84404
Hillcrest-Bonneville NeighborhoodEstimated Value: $301,000 - $354,000
4
Beds
2
Baths
1,616
Sq Ft
$200/Sq Ft
Est. Value
About This Home
This home is located at 580 10th St, Ogden, UT 84404 and is currently estimated at $323,646, approximately $200 per square foot. 580 10th St is a home located in Weber County with nearby schools including Bonneville School, Highland Junior High School, and Ben Lomond High School.
Ownership History
Date
Name
Owned For
Owner Type
Purchase Details
Closed on
Mar 28, 2001
Sold by
Norris Shane N and Searle Melanie M
Bought by
Child Ronald D and Child Marlene S
Current Estimated Value
Purchase Details
Closed on
Jul 15, 1997
Sold by
Green Jonathan S
Bought by
Norris Shane N and Searle Melanie M
Home Financials for this Owner
Home Financials are based on the most recent Mortgage that was taken out on this home.
Original Mortgage
$76,278
Interest Rate
7.83%
Mortgage Type
FHA
Purchase Details
Closed on
Mar 28, 1997
Sold by
Leatham Jim and Leatham Debra L
Bought by
Green Jonathan
Home Financials for this Owner
Home Financials are based on the most recent Mortgage that was taken out on this home.
Original Mortgage
$46,000
Interest Rate
7.96%
Mortgage Type
Balloon
Create a Home Valuation Report for This Property
The Home Valuation Report is an in-depth analysis detailing your home's value as well as a comparison with similar homes in the area
Home Values in the Area
Average Home Value in this Area
Purchase History
| Date | Buyer | Sale Price | Title Company |
|---|---|---|---|
| Child Ronald D | -- | Mountain View Title | |
| Norris Shane N | -- | Bonneville Title | |
| Green Jonathan | -- | Bonneville Title |
Source: Public Records
Mortgage History
| Date | Status | Borrower | Loan Amount |
|---|---|---|---|
| Open | Child Ronald D | $94,000 | |
| Closed | Child Ronald D | $13,209 | |
| Closed | Child Ronald D | $7,999 | |
| Previous Owner | Norris Shane N | $76,278 | |
| Previous Owner | Green Jonathan S | $46,000 |
Source: Public Records
Tax History Compared to Growth
Tax History
| Year | Tax Paid | Tax Assessment Tax Assessment Total Assessment is a certain percentage of the fair market value that is determined by local assessors to be the total taxable value of land and additions on the property. | Land | Improvement |
|---|---|---|---|---|
| 2025 | $2,195 | $321,798 | $101,329 | $220,469 |
| 2024 | $2,077 | $164,447 | $55,730 | $108,717 |
| 2023 | $1,864 | $148,500 | $50,923 | $97,577 |
| 2022 | $2,079 | $166,100 | $42,818 | $123,282 |
| 2021 | $1,652 | $218,999 | $48,082 | $170,917 |
| 2020 | $1,380 | $169,000 | $38,311 | $130,689 |
| 2019 | $1,400 | $161,000 | $28,487 | $132,513 |
| 2018 | $1,164 | $133,000 | $24,524 | $108,476 |
| 2017 | $918 | $98,000 | $24,524 | $73,476 |
| 2016 | $800 | $46,161 | $11,389 | $34,772 |
| 2015 | $726 | $40,861 | $11,389 | $29,472 |
| 2014 | $739 | $40,861 | $9,990 | $30,871 |
Source: Public Records
Map
Nearby Homes
- 987 S Jefferson Ave
- 968 S Jefferson Ave
- 1107 Jefferson Ave
- 454 Cross St
- 520 Chester St
- 1137 Liberty Ave
- 1116 Liberty Ave
- 3564 S Jefferson Ave
- 868 Washington Blvd
- 740 Adams Ave
- 358 E 11th St
- 524 14th St
- 590 7th St
- 965 Kiesel Ave
- 955 Kiesel Ave
- 544 7th St
- 805 12th St
- 1324 Liberty Ave
- 347 8th St
- 1084 S 865 E Unit 59
- 580 10th St
- 552 10th St
- 988 Porter Ave
- 979 Jefferson Ave
- 987 Jefferson Ave
- 975 Jefferson Ave
- 970 Porter Ave
- 1004 Porter Ave
- 969 Jefferson Ave
- 1017 Jefferson Ave
- 968 Porter Ave
- 963 Jefferson Ave
- 1021 Jefferson Ave
- 1112 Porter Ave
- 991 Porter Ave
- 979 Porter Ave
- 999 Porter Ave
- 971 Porter Ave
- 1005 Porter Ave
- 955 Jefferson Ave