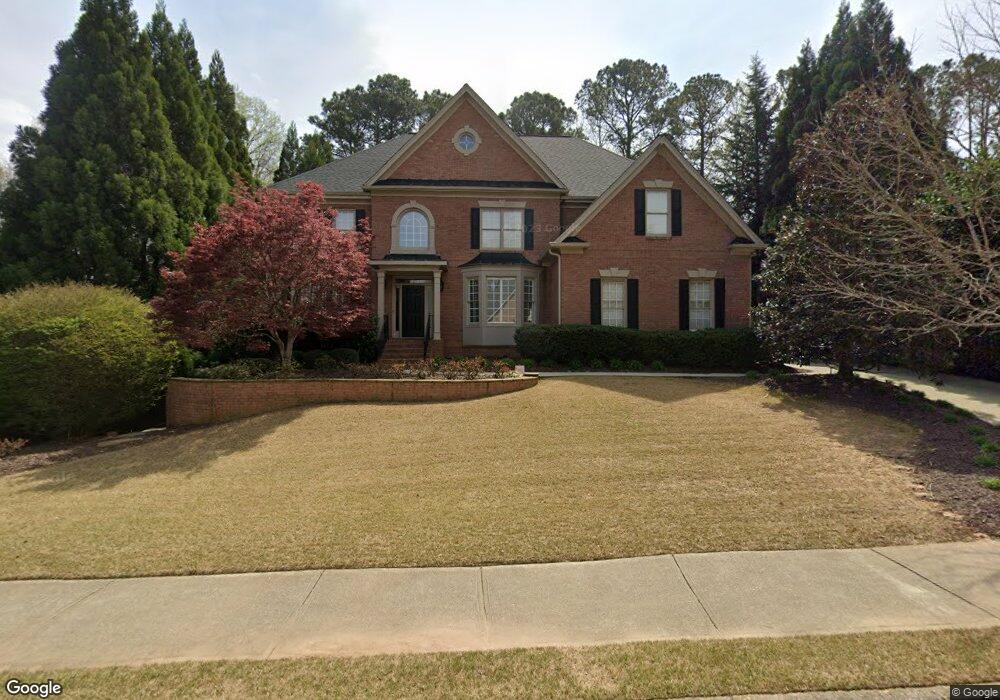
580 Barnesley Ln Unit XI Alpharetta, GA 30022
Estimated Value: $1,161,341 - $1,290,000
5
Beds
4
Baths
4,009
Sq Ft
$309/Sq Ft
Est. Value
About This Home
This home is located at 580 Barnesley Ln Unit XI, Alpharetta, GA 30022 and is currently estimated at $1,237,085, approximately $308 per square foot. 580 Barnesley Ln Unit XI is a home located in Fulton County with nearby schools including New Prospect Elementary School, Webb Bridge Middle School, and Alpharetta High School.
Ownership History
Date
Name
Owned For
Owner Type
Purchase Details
Closed on
Jul 25, 2016
Sold by
Gary
Bought by
Hubbard Tod A and Hubbard April B
Current Estimated Value
Home Financials for this Owner
Home Financials are based on the most recent Mortgage that was taken out on this home.
Original Mortgage
$507,000
Outstanding Balance
$403,384
Interest Rate
3.56%
Estimated Equity
$833,701
Purchase Details
Closed on
Jul 16, 2001
Sold by
Ken Fogle Builders Inc
Bought by
Nattrass Gary and Nattrass Gina M
Home Financials for this Owner
Home Financials are based on the most recent Mortgage that was taken out on this home.
Original Mortgage
$185,000
Interest Rate
7.08%
Mortgage Type
New Conventional
Create a Home Valuation Report for This Property
The Home Valuation Report is an in-depth analysis detailing your home's value as well as a comparison with similar homes in the area
Home Values in the Area
Average Home Value in this Area
Purchase History
| Date | Buyer | Sale Price | Title Company |
|---|---|---|---|
| Hubbard Tod A | $725,000 | -- | |
| Nattrass Gary | $512,800 | -- |
Source: Public Records
Mortgage History
| Date | Status | Borrower | Loan Amount |
|---|---|---|---|
| Open | Hubbard Tod A | $507,000 | |
| Previous Owner | Nattrass Gary | $185,000 |
Source: Public Records
Tax History Compared to Growth
Tax History
| Year | Tax Paid | Tax Assessment Tax Assessment Total Assessment is a certain percentage of the fair market value that is determined by local assessors to be the total taxable value of land and additions on the property. | Land | Improvement |
|---|---|---|---|---|
| 2025 | $1,380 | $415,800 | $130,120 | $285,680 |
| 2023 | $9,963 | $352,960 | $85,600 | $267,360 |
| 2022 | $6,307 | $286,440 | $62,880 | $223,560 |
| 2021 | $7,484 | $257,160 | $62,720 | $194,440 |
| 2020 | $7,541 | $259,800 | $47,800 | $212,000 |
| 2019 | $1,183 | $255,200 | $46,960 | $208,240 |
| 2018 | $6,510 | $249,200 | $45,840 | $203,360 |
| 2017 | $6,263 | $226,600 | $48,320 | $178,280 |
| 2016 | $6,262 | $226,600 | $48,320 | $178,280 |
| 2015 | $7,391 | $226,600 | $48,320 | $178,280 |
| 2014 | $6,069 | $210,720 | $44,920 | $165,800 |
Source: Public Records
Map
Nearby Homes
- 870 Longstone Landing
- 3010 Brooke View Ct Unit 5
- 4255 Park Brooke Trace
- 4345 Park Brooke Trace
- 3750 Brookside Pkwy Unit 37413033
- 5008 Avalon Dr
- 3087 Camden Way
- 3015 Camden Way
- 3027 Camden Way
- 10900 Wittenridge Dr Unit H8
- 10900 Wittenridge Dr Unit L6
- 4465 Park Brooke Trace Unit 5
- 345 Kincardine Way Unit IIIA
- 437 Argosy Park Cir
- 3962 Erin Dr
- 1005 Whitestone Ridge
- 3965 Brookline Dr
- 465 Kirkstall Trail
- 105 Kimball Bridge Cove
- 570 Barnesley Ln
- 300 N Saint Phillip Ln Unit XI
- 220 Radlett Ln Unit XI
- 615 Barnesley Ln
- 210 Radlett Ln Unit XI
- 605 Barnesley Ln
- 560 Barnesley Ln
- 625 Barnesley Ln
- 230 Radlett Ln
- 0 Radlett Ln Unit 7520484
- 200 Radlett Ln Unit XI
- 550 Barnesley Ln
- 0 Barnesley Ln Unit 7338149
- 0 Barnesley Ln Unit 7278579
- 0 Barnesley Ln Unit 8821220
- 0 Barnesley Ln Unit 8332199
- 0 Barnesley Ln Unit 8029616
- 0 Barnesley Ln Unit 7231919
- 0 Barnesley Ln Unit 3177495
- 0 Barnesley Ln Unit 8166233