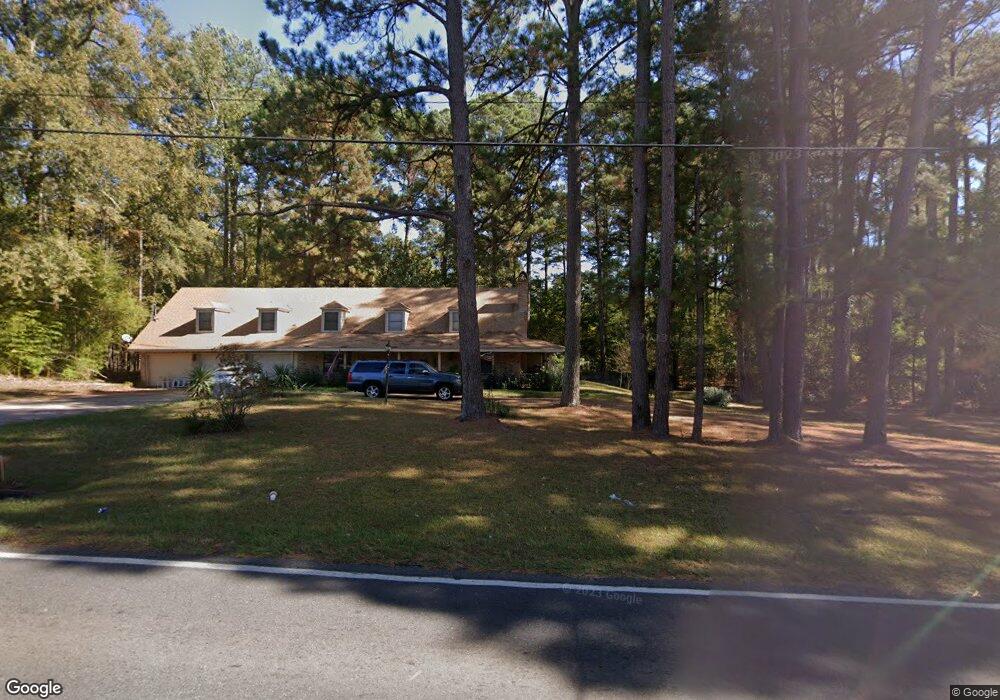
580 Cheniere Drew Rd West Monroe, LA 71291
Estimated Value: $267,000 - $337,691
4
Beds
3
Baths
3,012
Sq Ft
$100/Sq Ft
Est. Value
About This Home
This home is located at 580 Cheniere Drew Rd, West Monroe, LA 71291 and is currently estimated at $301,923, approximately $100 per square foot. 580 Cheniere Drew Rd is a home located in Ouachita Parish with nearby schools including Drew Elementary School, West Ridge Middle School, and West Monroe High School.
Ownership History
Date
Name
Owned For
Owner Type
Purchase Details
Closed on
Sep 30, 2014
Sold by
Wallace Virginia Humble
Bought by
Wallace Michael Richard
Current Estimated Value
Purchase Details
Closed on
Oct 28, 2011
Sold by
Linder Ronald Brian and Linder Janet Marie Craighead
Bought by
Wallace Michael Richard
Home Financials for this Owner
Home Financials are based on the most recent Mortgage that was taken out on this home.
Original Mortgage
$183,150
Outstanding Balance
$125,252
Interest Rate
4.08%
Mortgage Type
New Conventional
Estimated Equity
$176,671
Purchase Details
Closed on
Oct 5, 2006
Sold by
Jenkins Tracey Manley
Bought by
Linder Ronald Brian and Linder Janet M
Home Financials for this Owner
Home Financials are based on the most recent Mortgage that was taken out on this home.
Original Mortgage
$175,740
Interest Rate
6.46%
Mortgage Type
New Conventional
Create a Home Valuation Report for This Property
The Home Valuation Report is an in-depth analysis detailing your home's value as well as a comparison with similar homes in the area
Home Values in the Area
Average Home Value in this Area
Purchase History
| Date | Buyer | Sale Price | Title Company |
|---|---|---|---|
| Wallace Michael Richard | -- | None Available | |
| Wallace Michael Richard | $229,000 | Mullens Price North Delta Ti | |
| Linder Ronald Brian | $202,000 | Title West |
Source: Public Records
Mortgage History
| Date | Status | Borrower | Loan Amount |
|---|---|---|---|
| Open | Wallace Michael Richard | $183,150 | |
| Previous Owner | Linder Ronald Brian | $175,740 |
Source: Public Records
Tax History Compared to Growth
Tax History
| Year | Tax Paid | Tax Assessment Tax Assessment Total Assessment is a certain percentage of the fair market value that is determined by local assessors to be the total taxable value of land and additions on the property. | Land | Improvement |
|---|---|---|---|---|
| 2024 | $1,722 | $25,854 | $4,500 | $21,354 |
| 2023 | $1,722 | $24,609 | $4,500 | $20,109 |
| 2022 | $2,183 | $24,242 | $4,500 | $19,742 |
| 2021 | $2,210 | $24,609 | $4,500 | $20,109 |
| 2020 | $2,210 | $24,609 | $4,500 | $20,109 |
| 2019 | $1,862 | $20,790 | $2,300 | $18,490 |
| 2018 | $1,190 | $20,789 | $2,300 | $18,489 |
| 2017 | $1,862 | $20,356 | $2,300 | $18,056 |
| 2016 | $1,861 | $22,900 | $3,664 | $19,236 |
| 2015 | $1,376 | $22,900 | $3,664 | $19,236 |
| 2014 | $1,376 | $22,900 | $3,664 | $19,236 |
| 2013 | $1,371 | $22,900 | $3,664 | $19,236 |
Source: Public Records
Map
Nearby Homes
- 830 Ole Highway 15
- 150 Ingram Rd
- 112 Hillside Cir
- 106 Brooks Ln
- 00 Lou Dr
- 0 Lou Dr
- 139 Autumn Place Dr
- 300 Hillside Cir
- 0 Louisiana 546 Unit 148 McCormick Road
- 0 Louisiana 546 Unit 217025
- 0 Louisiana 546 Unit 214684
- 120 Heritage Dr
- 127 Henry Rd
- 113 Windridge Dr
- 119 Lacrosse Cir
- 100 Aspen Cir
- 205 Chapel Hill Place
- 118 Country Estates Dr
- 000 Strozier Rd
- 0 Cheniere Hills Dr
- 614 Cheniere Drew Rd
- 546 Cheniere Drew Rd
- 582 Cheniere Drew Rd
- 540 Cheniere Drew Rd
- 624 Cheniere Drew Rd
- 0 Cheniere-Drew Rd
- 542 Cheniere Drew Rd
- 710 Cheniere Drew Rd
- 512 Cheniere Drew Rd
- 547 Cheniere Drew Rd
- 124 Fisher Rd
- 125 Fisher Rd
- 125 Azalea Ln
- 133 Wales Clark Rd
- 754 Cheniere Drew Rd
- 153 Fisher Rd
- 158 Fisher Rd
- 199 Azalea Ln
- 491 Cheniere Drew Rd
- 456 Cheniere Drew Rd