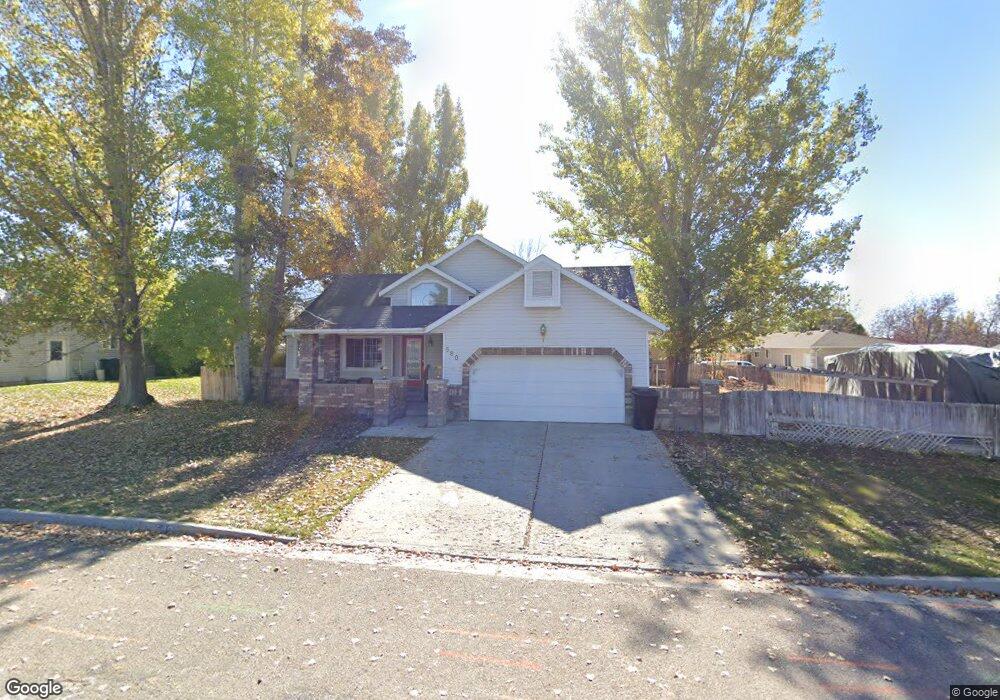
580 E 100 N Ephraim, UT 84627
Estimated Value: $445,000
5
Beds
3
Baths
2,667
Sq Ft
$167/Sq Ft
Est. Value
About This Home
This home is located at 580 E 100 N, Ephraim, UT 84627 and is currently estimated at $445,000, approximately $166 per square foot. 580 E 100 N is a home located in Sanpete County.
Ownership History
Date
Name
Owned For
Owner Type
Purchase Details
Closed on
Jul 22, 2019
Sold by
Strate Amy L
Bought by
Mbp Rentals Series 580 East Llc
Current Estimated Value
Purchase Details
Closed on
May 21, 2018
Sold by
Hunter Hamilton
Bought by
Strate Amy L
Home Financials for this Owner
Home Financials are based on the most recent Mortgage that was taken out on this home.
Original Mortgage
$222,775
Interest Rate
4.4%
Mortgage Type
New Conventional
Purchase Details
Closed on
Feb 28, 2007
Sold by
Day Gary and Day Marcia T
Bought by
Mcclanahan Richard D and Mcclanahan Beth A
Create a Home Valuation Report for This Property
The Home Valuation Report is an in-depth analysis detailing your home's value as well as a comparison with similar homes in the area
Home Values in the Area
Average Home Value in this Area
Purchase History
| Date | Buyer | Sale Price | Title Company |
|---|---|---|---|
| Mbp Rentals Series 580 East Llc | -- | -- | |
| Strate Amy L | $278,468 | First American-Ephraim | |
| Mcclanahan Richard D | -- | -- |
Source: Public Records
Mortgage History
| Date | Status | Borrower | Loan Amount |
|---|---|---|---|
| Previous Owner | Strate Amy L | $222,775 |
Source: Public Records
Tax History
| Year | Tax Paid | Tax Assessment Tax Assessment Total Assessment is a certain percentage of the fair market value that is determined by local assessors to be the total taxable value of land and additions on the property. | Land | Improvement |
|---|---|---|---|---|
| 2025 | $2,304 | $223,252 | $0 | $0 |
| 2024 | $2,317 | $213,372 | $0 | $0 |
| 2023 | $2,286 | $200,349 | $0 | $0 |
| 2022 | $2,267 | $181,016 | $0 | $0 |
| 2021 | $2,199 | $151,746 | $0 | $0 |
| 2020 | $2,045 | $132,868 | $0 | $0 |
| 2019 | $1,931 | $123,439 | $0 | $0 |
| 2018 | $1,743 | $195,160 | $31,680 | $163,480 |
| 2017 | $1,554 | $100,209 | $0 | $0 |
| 2016 | $1,468 | $94,683 | $0 | $0 |
| 2015 | $1,475 | $94,683 | $0 | $0 |
| 2014 | $1,451 | $94,683 | $0 | $0 |
| 2013 | $1,445 | $94,683 | $0 | $0 |
Source: Public Records
Map
Nearby Homes
Your Personal Tour Guide
Ask me questions while you tour the home.