Estimated Value: $671,000 - $832,000
6
Beds
7
Baths
4,640
Sq Ft
$165/Sq Ft
Est. Value
About This Home
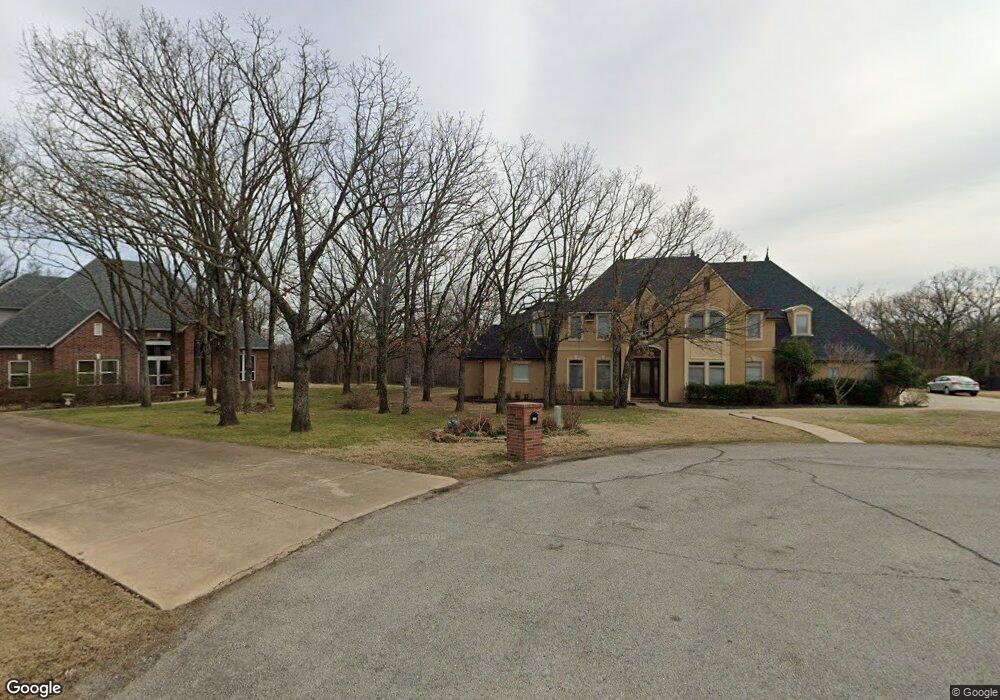
This home is located at 580 E 113th St S, Jenks, OK 74037 and is currently estimated at $767,545, approximately $165 per square foot. 580 E 113th St S is a home located in Tulsa County with nearby schools including Jenks West Elementary School, Jenks West Intermediate Elementary School, and Jenks Middle School.
Ownership History
Date
Name
Owned For
Owner Type
Purchase Details
Closed on
Jun 9, 2006
Sold by
Trimble Allan and Trimble Courtney
Bought by
Wood William R and Wood Kandi M
Current Estimated Value
Home Financials for this Owner
Home Financials are based on the most recent Mortgage that was taken out on this home.
Original Mortgage
$58,225
Interest Rate
6.56%
Mortgage Type
Unknown
Purchase Details
Closed on
Dec 13, 1999
Sold by
Hughes Richard and Hughes Tad
Bought by
Trimble Allan and Trimble Courtney
Home Financials for this Owner
Home Financials are based on the most recent Mortgage that was taken out on this home.
Original Mortgage
$30,000
Interest Rate
7.69%
Mortgage Type
Seller Take Back
Purchase Details
Closed on
Nov 30, 1999
Sold by
Dobbs Bradford G
Bought by
Hughes Tad and Dobbs Tad
Home Financials for this Owner
Home Financials are based on the most recent Mortgage that was taken out on this home.
Original Mortgage
$30,000
Interest Rate
7.69%
Mortgage Type
Seller Take Back
Purchase Details
Closed on
May 1, 1991
Create a Home Valuation Report for This Property
The Home Valuation Report is an in-depth analysis detailing your home's value as well as a comparison with similar homes in the area
Home Values in the Area
Average Home Value in this Area
Purchase History
| Date | Buyer | Sale Price | Title Company |
|---|---|---|---|
| Wood William R | $68,500 | First American Title & Abstr | |
| Trimble Allan | $40,000 | -- | |
| Hughes Tad | -- | -- | |
| -- | $16,000 | -- |
Source: Public Records
Mortgage History
| Date | Status | Borrower | Loan Amount |
|---|---|---|---|
| Closed | Wood William R | $58,225 | |
| Previous Owner | Trimble Allan | $30,000 |
Source: Public Records
Tax History
| Year | Tax Paid | Tax Assessment Tax Assessment Total Assessment is a certain percentage of the fair market value that is determined by local assessors to be the total taxable value of land and additions on the property. | Land | Improvement |
|---|---|---|---|---|
| 2025 | $8,025 | $63,973 | $7,450 | $56,523 |
| 2024 | $7,670 | $62,081 | $7,195 | $54,886 |
| 2023 | $7,670 | $61,244 | $6,470 | $54,774 |
| 2022 | $7,515 | $58,460 | $7,630 | $50,830 |
| 2021 | $7,387 | $56,728 | $7,404 | $49,324 |
| 2020 | $7,224 | $56,728 | $7,404 | $49,324 |
| 2019 | $7,274 | $56,728 | $7,404 | $49,324 |
| 2018 | $7,323 | $56,728 | $7,404 | $49,324 |
| 2017 | $7,203 | $57,728 | $7,535 | $50,193 |
| 2016 | $7,380 | $57,728 | $7,535 | $50,193 |
| 2015 | $7,521 | $57,728 | $7,535 | $50,193 |
| 2014 | $7,691 | $57,728 | $7,535 | $50,193 |
Source: Public Records
Map
Nearby Homes
- 11607 S 5th St
- 418 E 111th St S
- 1734 W 115th Place
- 11112 S 3rd St
- 11207 S 1st St
- 110 W 114th St S
- 11427 S Ash St
- 107 E 116th Place
- 11471 S Ash St
- 224 E 118th St S
- 199 W 113th Ct S
- 701 E 119th St S
- 11129 S Date St
- 11922 S Birch Ave
- 682 W 113th Ct S
- 12207 S 12th Ct
- 12116 S 14th Ct
- 12110 S 14th Ct
- 691 W 113th Ct S
- 11920 S Cedar Ave
- 586 E 113th St S
- 570 E 113th St S
- 583 E 113th St S
- 11511 S 5th Place
- 447 E 113th St S
- 577 E 113th St S
- 565 E 113th St S
- 470 E 113th St S
- 1626 W 115th Ct
- 11515 S 5th Place
- 555 E 113th St S
- 466 E 113th St S
- 11508 S 5th Place
- 458 E 113th St S
- 11516 S 5th Place
- 11493 S 4th St
- 446 E 113th St S
- S S 4th St
- 0 S 4th Place Unit 2034299
- 11523 S 5th Place
Your Personal Tour Guide
Ask me questions while you tour the home.