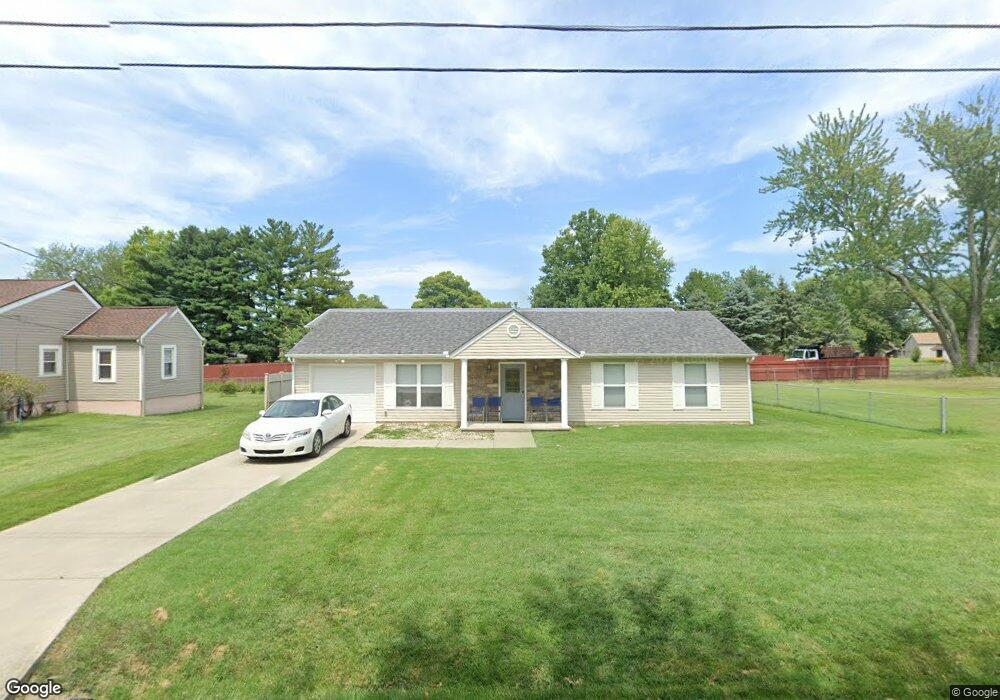
580 Hamblin Dr Cincinnati, OH 45255
Estimated Value: $239,554 - $286,000
3
Beds
2
Baths
1,144
Sq Ft
$227/Sq Ft
Est. Value
About This Home
This home is located at 580 Hamblin Dr, Cincinnati, OH 45255 and is currently estimated at $259,389, approximately $226 per square foot. 580 Hamblin Dr is a home located in Clermont County with nearby schools including Withamsville-Tobasco Elementary School, West Clermont Middle School, and West Clermont High School.
Ownership History
Date
Name
Owned For
Owner Type
Purchase Details
Closed on
Dec 31, 2019
Sold by
Schaefer Lee Ann
Bought by
Spille John R
Current Estimated Value
Home Financials for this Owner
Home Financials are based on the most recent Mortgage that was taken out on this home.
Original Mortgage
$135,000
Outstanding Balance
$119,278
Interest Rate
3.6%
Mortgage Type
New Conventional
Estimated Equity
$140,111
Purchase Details
Closed on
Jan 15, 2008
Sold by
Teh Construction Inc
Bought by
Schaefer Lee Ann
Home Financials for this Owner
Home Financials are based on the most recent Mortgage that was taken out on this home.
Original Mortgage
$80,000
Interest Rate
6.17%
Mortgage Type
Purchase Money Mortgage
Purchase Details
Closed on
Jun 25, 2007
Sold by
Nashco Inc
Bought by
Teh Construction Inc
Create a Home Valuation Report for This Property
The Home Valuation Report is an in-depth analysis detailing your home's value as well as a comparison with similar homes in the area
Purchase History
| Date | Buyer | Sale Price | Title Company |
|---|---|---|---|
| Spille John R | $150,000 | Kentucky Land Title Agency | |
| Schaefer Lee Ann | $125,000 | Prominent Title Agency Llc | |
| Teh Construction Inc | $22,500 | Attorney |
Source: Public Records
Mortgage History
| Date | Status | Borrower | Loan Amount |
|---|---|---|---|
| Open | Spille John R | $135,000 | |
| Previous Owner | Schaefer Lee Ann | $80,000 |
Source: Public Records
Tax History
| Year | Tax Paid | Tax Assessment Tax Assessment Total Assessment is a certain percentage of the fair market value that is determined by local assessors to be the total taxable value of land and additions on the property. | Land | Improvement |
|---|---|---|---|---|
| 2024 | $2,897 | $57,440 | $7,670 | $49,770 |
| 2023 | $2,901 | $57,440 | $7,670 | $49,770 |
| 2022 | $2,501 | $42,920 | $5,710 | $37,210 |
| 2021 | $2,511 | $42,920 | $5,710 | $37,210 |
| 2020 | $2,514 | $42,920 | $5,710 | $37,210 |
| 2019 | $2,057 | $41,060 | $8,650 | $32,410 |
| 2018 | $2,078 | $41,060 | $8,650 | $32,410 |
| 2017 | $2,250 | $41,060 | $8,650 | $32,410 |
| 2016 | $2,250 | $40,250 | $8,470 | $31,780 |
| 2015 | $2,183 | $40,250 | $8,470 | $31,780 |
| 2014 | $2,183 | $40,250 | $8,470 | $31,780 |
| 2013 | $2,015 | $36,750 | $8,470 | $28,280 |
Source: Public Records
Map
Nearby Homes
- 4182 Mount Carmel Tobasco Rd
- 537 Tradition Ridge
- 539 Tradition Ridge
- 535 Tradition Ridge
- 533 Tradition Ridge
- 549 Tradition Ridge
- 525 Tradition Ridge
- 527 Tradition Ridge
- 541 Tradition Ridge
- 543 Tradition Ridge
- 523 Tradition Ridge
- 531 Tradition Ridge
- 529 Tradition Ridge
- 547 Tradition Ridge
- 0 Clough Pike Unit 1861584
- 651 Clough Pike
- 425 Mcintosh Dr Unit 22A
- 4218 Zagar Dr
- 586 Brantner Ln
- 4353 Mount Carmel Tobasco Rd
- 580 Hamblin Ln
- 576 Hamblin Dr
- 577 Hamblin Dr
- 586 Hamblin Dr
- 581 Hamblin Dr
- 575 Sherry Ln
- 585 Hamblin Dr
- 571 Sherry Ln
- 579 Sherry Ln
- 4220 Mount Carmel Tobasco Rd
- 589 Hamblin Dr
- 567 Sherry Ln
- 4212 Mount Carmel Tobasco Rd
- 4206 Mount Carmel Tobasco Rd
- 4222 Mount Carmel Tobasco Rd
- 591 Hamblin Dr
- 592 Hamblin Dr
- 593 Hamblin Dr
- 574 Sherry Ln
- 578 Sherry Ln
Your Personal Tour Guide
Ask me questions while you tour the home.