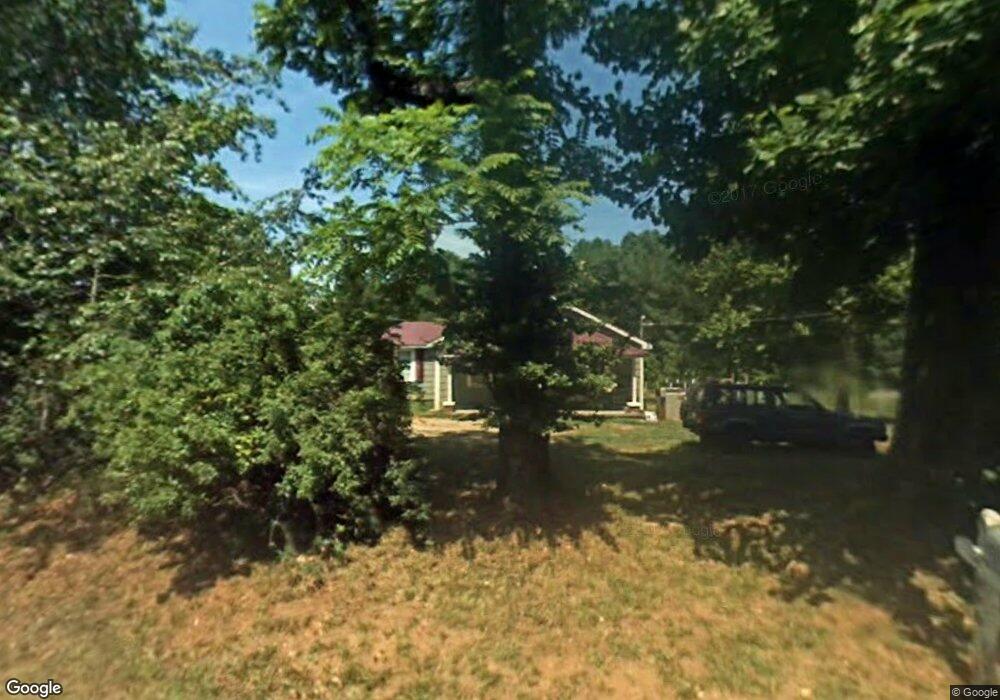
580 John W Moore Rd Dahlonega, GA 30533
Estimated Value: $173,000 - $260,000
--
Bed
1
Bath
930
Sq Ft
$233/Sq Ft
Est. Value
About This Home
This home is located at 580 John W Moore Rd, Dahlonega, GA 30533 and is currently estimated at $216,811, approximately $233 per square foot. 580 John W Moore Rd is a home located in Lumpkin County with nearby schools including Lumpkin County High School.
Ownership History
Date
Name
Owned For
Owner Type
Purchase Details
Closed on
Sep 30, 2020
Sold by
Davis Adelard John
Bought by
Wilkins Kyle Glenn and Hunnewell Emma Lee
Current Estimated Value
Home Financials for this Owner
Home Financials are based on the most recent Mortgage that was taken out on this home.
Original Mortgage
$124,747
Outstanding Balance
$110,956
Interest Rate
2.9%
Mortgage Type
New Conventional
Estimated Equity
$105,855
Purchase Details
Closed on
Feb 16, 2007
Sold by
Not Provided
Bought by
Davis Adelard John and Davis Judy L
Home Financials for this Owner
Home Financials are based on the most recent Mortgage that was taken out on this home.
Original Mortgage
$62,400
Interest Rate
6.16%
Mortgage Type
New Conventional
Purchase Details
Closed on
Jan 24, 1994
Sold by
Jones Izora Lee
Bought by
Lingerfelt Bonnie J
Purchase Details
Closed on
Dec 1, 1979
Bought by
Jones Izora Lee
Create a Home Valuation Report for This Property
The Home Valuation Report is an in-depth analysis detailing your home's value as well as a comparison with similar homes in the area
Home Values in the Area
Average Home Value in this Area
Purchase History
| Date | Buyer | Sale Price | Title Company |
|---|---|---|---|
| Wilkins Kyle Glenn | $123,500 | -- | |
| Davis Adelard John | $78,000 | -- | |
| Lingerfelt Bonnie J | -- | -- | |
| Jones Izora Lee | -- | -- |
Source: Public Records
Mortgage History
| Date | Status | Borrower | Loan Amount |
|---|---|---|---|
| Open | Wilkins Kyle Glenn | $124,747 | |
| Previous Owner | Davis Adelard John | $62,400 |
Source: Public Records
Tax History Compared to Growth
Tax History
| Year | Tax Paid | Tax Assessment Tax Assessment Total Assessment is a certain percentage of the fair market value that is determined by local assessors to be the total taxable value of land and additions on the property. | Land | Improvement |
|---|---|---|---|---|
| 2024 | $1,425 | $63,052 | $7,894 | $55,158 |
| 2023 | $1,375 | $58,457 | $7,176 | $51,281 |
| 2022 | $1,181 | $47,684 | $5,978 | $41,706 |
| 2021 | $1,034 | $40,396 | $5,978 | $34,418 |
| 2020 | $693 | $26,271 | $5,725 | $20,546 |
| 2019 | $699 | $26,271 | $5,725 | $20,546 |
| 2017 | $687 | $23,763 | $5,725 | $18,038 |
| 2016 | $641 | $21,438 | $5,725 | $15,713 |
| 2015 | $577 | $21,438 | $5,725 | $15,713 |
| 2014 | $577 | $21,895 | $5,725 | $16,170 |
| 2013 | -- | $22,352 | $5,725 | $16,626 |
Source: Public Records
Map
Nearby Homes
- 22 Deer Ridge Rd
- 955 Camp Wahsega Rd
- 357 Camp Wahsega Rd
- 0 Camp Wahsega Rd Unit 7600956
- 0 Camp Wahsega Rd Unit 10547292
- 96 Elbert Gaddis Rd
- 98 Elbert Gaddis Rd
- 181 Gilreath Way
- 26 Dowdy Ct
- 122 Tritt Rd
- 1879 Camp Wahsega Rd
- 64 Hickory Ln
- 239 Glenn Elliott Rd
- LOT 1 the Overlook at Crown Mountain
- Tr 3 Glenn Elliot Rd
- 81 Anderson Dr
- 77 Old River Rd
- 100 Sanders Blvd
- 120 Sanders Blvd
- 0 Cherrystone Walk
- 549 John W Moore Rd
- 0 Colony Dr
- 615 Camp Wahsega Rd
- 611 Camp Wahsega Rd
- 695 Camp Wahsega Rd
- 76 Colony Dr
- 99 Colony Dr
- 738 Camp Wahsega Rd
- 98 Colony Dr
- 455 John W Moore Rd
- 81 Cherrystone Walk
- 11.3AC Camp Wahsega Rd
- 454 John W Moore Rd
- 0 Black Mountain Rd Unit 5974871
- 0 Black Mountain Rd Unit 8342576
- 0 Black Mountain Rd Unit LOT 7 7253424
- 0 Black Mountain Rd Unit LOT 6 7253419
- 0 Black Mountain Rd Unit LOT 5 7253411
- 0 Black Mountain Rd Unit LOT 4 7253400