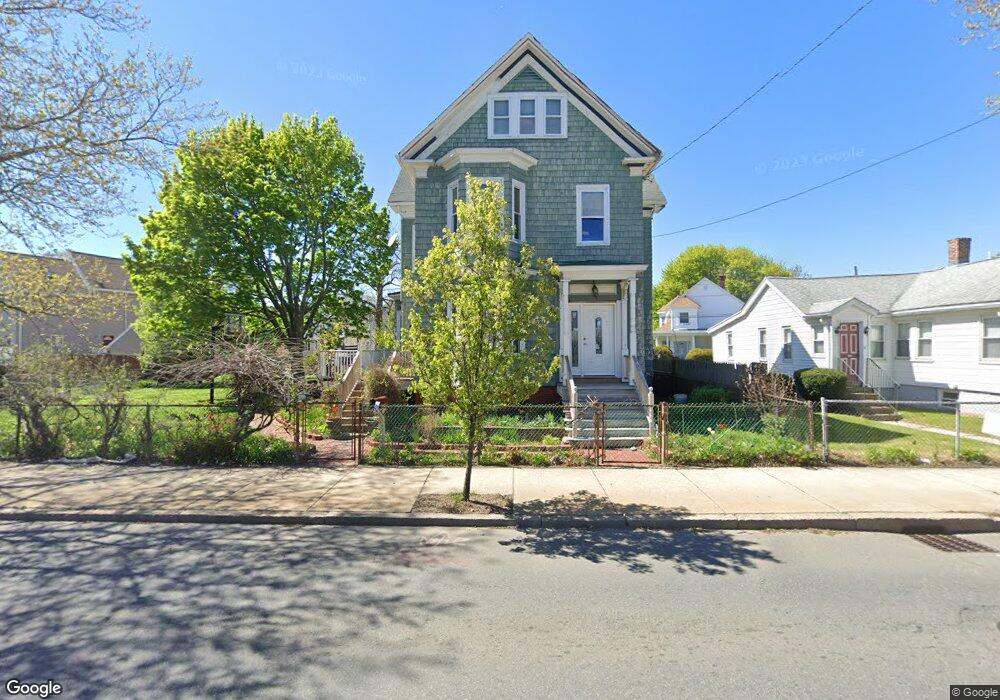
580 Lynn St Malden, MA 02148
Linden NeighborhoodEstimated Value: $722,000 - $810,043
3
Beds
2
Baths
2,618
Sq Ft
$294/Sq Ft
Est. Value
About This Home
This home is located at 580 Lynn St, Malden, MA 02148 and is currently estimated at $769,511, approximately $293 per square foot. 580 Lynn St is a home located in Middlesex County with nearby schools including Malden High School and Malden Catholic.
Ownership History
Date
Name
Owned For
Owner Type
Purchase Details
Closed on
Mar 21, 2022
Sold by
Contes-Palma Maria A
Bought by
Palma Ft
Current Estimated Value
Purchase Details
Closed on
Jul 1, 1998
Sold by
Panowicz Thomas B
Bought by
Palma Eneas S and Palma Maria A
Home Financials for this Owner
Home Financials are based on the most recent Mortgage that was taken out on this home.
Original Mortgage
$161,500
Interest Rate
7.04%
Mortgage Type
Purchase Money Mortgage
Create a Home Valuation Report for This Property
The Home Valuation Report is an in-depth analysis detailing your home's value as well as a comparison with similar homes in the area
Home Values in the Area
Average Home Value in this Area
Purchase History
| Date | Buyer | Sale Price | Title Company |
|---|---|---|---|
| Palma Ft | -- | None Available | |
| Palma Eneas S | $190,000 | -- | |
| Palma Eneas S | $190,000 | -- |
Source: Public Records
Mortgage History
| Date | Status | Borrower | Loan Amount |
|---|---|---|---|
| Previous Owner | Palma Eneas S | $161,500 |
Source: Public Records
Tax History Compared to Growth
Tax History
| Year | Tax Paid | Tax Assessment Tax Assessment Total Assessment is a certain percentage of the fair market value that is determined by local assessors to be the total taxable value of land and additions on the property. | Land | Improvement |
|---|---|---|---|---|
| 2025 | $79 | $702,000 | $352,900 | $349,100 |
| 2024 | $7,476 | $639,500 | $332,100 | $307,400 |
| 2023 | $7,364 | $604,100 | $301,000 | $303,100 |
| 2022 | $6,933 | $561,400 | $275,000 | $286,400 |
| 2021 | $6,599 | $536,900 | $259,400 | $277,500 |
| 2020 | $6,583 | $520,400 | $261,500 | $258,900 |
| 2019 | $6,474 | $487,900 | $249,100 | $238,800 |
| 2018 | $6,174 | $438,200 | $210,200 | $228,000 |
| 2017 | $5,848 | $412,700 | $197,200 | $215,500 |
| 2016 | $5,746 | $379,000 | $186,800 | $192,200 |
| 2015 | $5,402 | $343,400 | $165,500 | $177,900 |
| 2014 | $5,171 | $321,200 | $150,500 | $170,700 |
Source: Public Records
Map
Nearby Homes
- 32 Delta Terrace
- 563 Lynn St
- 14 Vining St
- 4 Anderson Way Unit 2
- 65 Beach St Unit 65
- 109 Salem St Unit 405
- 770 Washington Ave Unit 405
- 26 Beach St
- 133 Salem St Unit 416
- 133 Salem St Unit 313
- 133 Salem St Unit 412
- 133 Salem St Unit 318
- 133 Salem St Unit 107
- 133 Salem St Unit 409
- 133 Salem St Unit 214
- 133 Salem St Unit 307
- 133 Salem St Unit 417
- 133 Salem St Unit 115
- 133 Salem St Unit 408
- 133 Salem St Unit 414