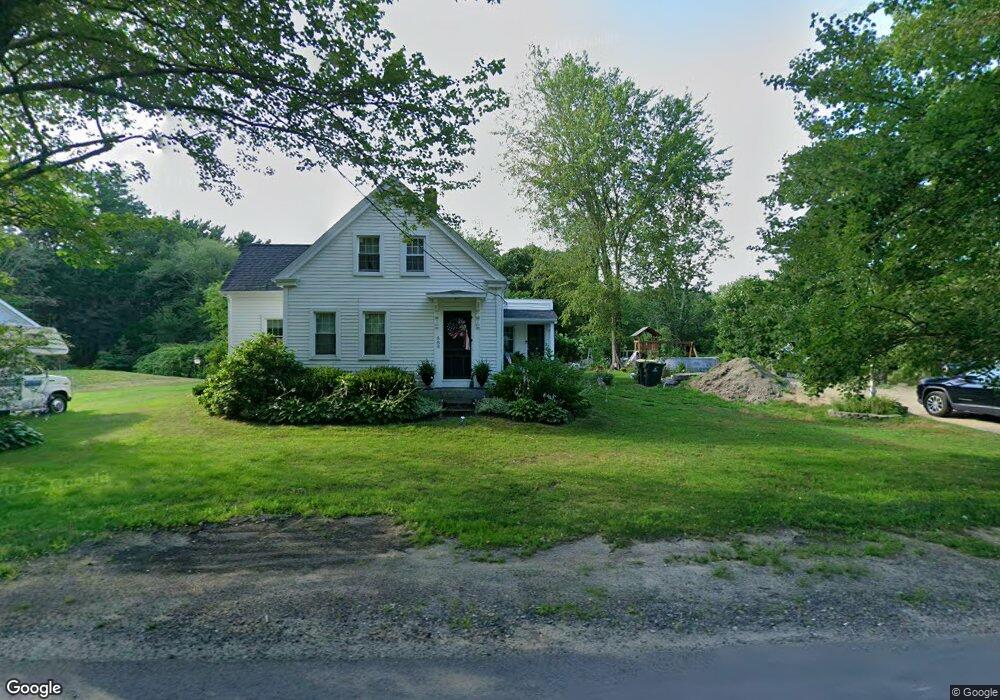
580 Main St Hanson, MA 02341
Estimated Value: $450,000 - $643,000
3
Beds
2
Baths
1,830
Sq Ft
$293/Sq Ft
Est. Value
About This Home
This home is located at 580 Main St, Hanson, MA 02341 and is currently estimated at $536,188, approximately $292 per square foot. 580 Main St is a home located in Plymouth County.
Ownership History
Date
Name
Owned For
Owner Type
Purchase Details
Closed on
Apr 20, 2004
Sold by
Marini Francis L
Bought by
Brett Harry J and Brett Jacqueline M
Current Estimated Value
Home Financials for this Owner
Home Financials are based on the most recent Mortgage that was taken out on this home.
Original Mortgage
$205,000
Outstanding Balance
$95,932
Interest Rate
5.58%
Mortgage Type
Purchase Money Mortgage
Estimated Equity
$440,256
Purchase Details
Closed on
Mar 11, 1994
Sold by
Finski Rt
Bought by
Marini Francis L
Home Financials for this Owner
Home Financials are based on the most recent Mortgage that was taken out on this home.
Original Mortgage
$116,900
Interest Rate
6.93%
Mortgage Type
Purchase Money Mortgage
Purchase Details
Closed on
Oct 23, 1990
Sold by
Newey Richard C
Bought by
Finnski Rt
Home Financials for this Owner
Home Financials are based on the most recent Mortgage that was taken out on this home.
Original Mortgage
$110,000
Interest Rate
10.14%
Mortgage Type
Purchase Money Mortgage
Create a Home Valuation Report for This Property
The Home Valuation Report is an in-depth analysis detailing your home's value as well as a comparison with similar homes in the area
Home Values in the Area
Average Home Value in this Area
Purchase History
| Date | Buyer | Sale Price | Title Company |
|---|---|---|---|
| Brett Harry J | $308,800 | -- | |
| Marini Francis L | $129,900 | -- | |
| Finnski Rt | $115,000 | -- |
Source: Public Records
Mortgage History
| Date | Status | Borrower | Loan Amount |
|---|---|---|---|
| Open | Finnski Rt | $25,000 | |
| Open | Finnski Rt | $205,000 | |
| Previous Owner | Finnski Rt | $116,900 | |
| Previous Owner | Finnski Rt | $110,000 |
Source: Public Records
Tax History
| Year | Tax Paid | Tax Assessment Tax Assessment Total Assessment is a certain percentage of the fair market value that is determined by local assessors to be the total taxable value of land and additions on the property. | Land | Improvement |
|---|---|---|---|---|
| 2025 | $5,577 | $416,800 | $162,900 | $253,900 |
| 2024 | $5,415 | $404,700 | $158,200 | $246,500 |
| 2023 | $4,996 | $352,300 | $158,200 | $194,100 |
| 2022 | $4,793 | $317,600 | $143,800 | $173,800 |
| 2021 | $707 | $285,700 | $138,300 | $147,400 |
| 2020 | $4,018 | $263,100 | $133,600 | $129,500 |
| 2019 | $3,865 | $248,900 | $131,000 | $117,900 |
| 2018 | $7,246 | $239,500 | $126,000 | $113,500 |
| 2017 | $3,647 | $228,200 | $120,000 | $108,200 |
| 2016 | $3,396 | $205,200 | $120,000 | $85,200 |
| 2015 | $3,244 | $203,800 | $120,000 | $83,800 |
Source: Public Records
Map
Nearby Homes
Your Personal Tour Guide
Ask me questions while you tour the home.