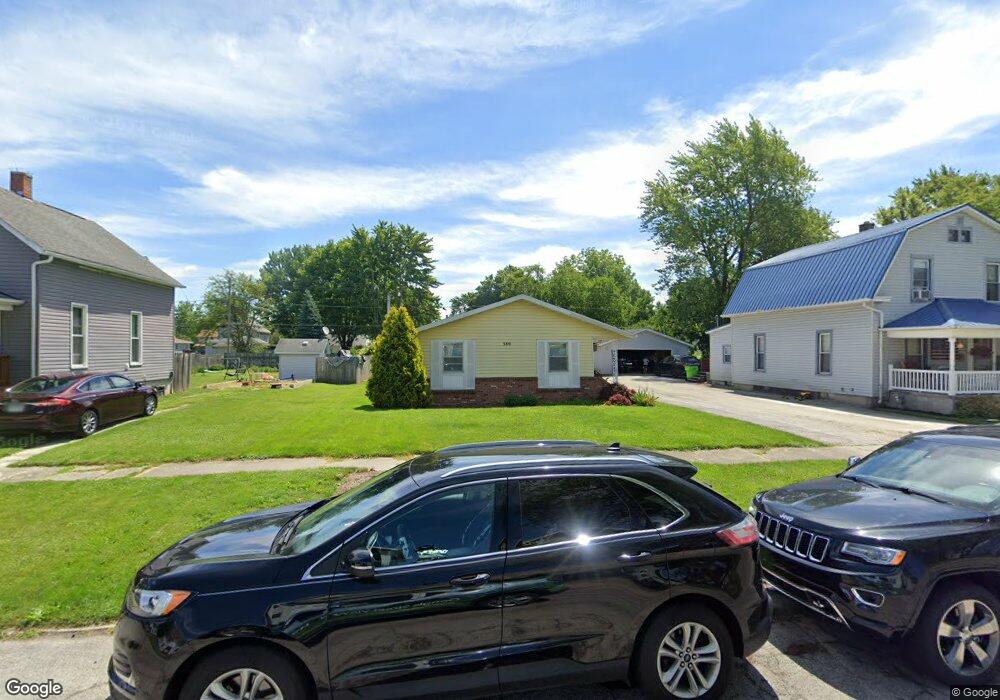
580 Maple St Fostoria, OH 44830
Estimated Value: $73,000 - $92,000
6
Beds
3
Baths
2,040
Sq Ft
$42/Sq Ft
Est. Value
About This Home
This home is located at 580 Maple St, Fostoria, OH 44830 and is currently estimated at $85,667, approximately $41 per square foot. 580 Maple St is a home with nearby schools including Fostoria Intermediate Elementary School and Fostoria Junior/Senior High School.
Ownership History
Date
Name
Owned For
Owner Type
Purchase Details
Closed on
Aug 11, 2023
Sold by
M P E Llc
Bought by
Mep Property Management Llc
Current Estimated Value
Home Financials for this Owner
Home Financials are based on the most recent Mortgage that was taken out on this home.
Original Mortgage
$453,606
Outstanding Balance
$443,555
Interest Rate
6.96%
Mortgage Type
New Conventional
Estimated Equity
-$357,888
Purchase Details
Closed on
Apr 27, 2018
Sold by
M P E Llc
Bought by
M E P Property Management Llc
Purchase Details
Closed on
Dec 23, 2002
Sold by
Yonker Gregory R
Bought by
Mpe Llc
Create a Home Valuation Report for This Property
The Home Valuation Report is an in-depth analysis detailing your home's value as well as a comparison with similar homes in the area
Home Values in the Area
Average Home Value in this Area
Purchase History
| Date | Buyer | Sale Price | Title Company |
|---|---|---|---|
| Mep Property Management Llc | $79,000 | Whitman Title | |
| M E P Property Management Llc | -- | None Available | |
| Mpe Llc | -- | -- |
Source: Public Records
Mortgage History
| Date | Status | Borrower | Loan Amount |
|---|---|---|---|
| Open | Mep Property Management Llc | $453,606 |
Source: Public Records
Tax History Compared to Growth
Tax History
| Year | Tax Paid | Tax Assessment Tax Assessment Total Assessment is a certain percentage of the fair market value that is determined by local assessors to be the total taxable value of land and additions on the property. | Land | Improvement |
|---|---|---|---|---|
| 2024 | $1,712 | $33,190 | $5,360 | $27,830 |
| 2023 | $1,715 | $33,190 | $5,360 | $27,830 |
| 2022 | $1,656 | $28,550 | $4,440 | $24,110 |
| 2021 | $1,692 | $28,550 | $4,440 | $24,110 |
| 2020 | $1,700 | $28,550 | $4,438 | $24,112 |
| 2019 | $1,653 | $27,559 | $4,284 | $23,275 |
| 2018 | $1,685 | $27,559 | $4,284 | $23,275 |
| 2017 | $1,684 | $27,559 | $4,284 | $23,275 |
| 2016 | $1,570 | $28,722 | $1,866 | $26,856 |
| 2015 | $1,546 | $28,722 | $1,866 | $26,856 |
| 2014 | $1,474 | $28,722 | $1,866 | $26,856 |
| 2013 | $1,592 | $28,721 | $2,030 | $26,691 |
Source: Public Records
Map
Nearby Homes
- 540 N Poplar St
- 220 E High St
- 633 Maple St
- 321 Mcdougal St
- 520 N Union St
- 723 N Union St
- 931 N Union St
- 827 Buckley St
- 711 Circle Dr
- 203 N Union St
- 412 E Center St
- 207 W Culbertson St
- 892 N Countyline St
- 481 Beverly Dr
- 900 N Countyline St
- 133 E South St
- 0 W South Route 12
- 509 College Ave
- 429 S Town St
- 348 W South St