Estimated Value: $177,000 - $218,000
3
Beds
1
Bath
1,034
Sq Ft
$188/Sq Ft
Est. Value
About This Home
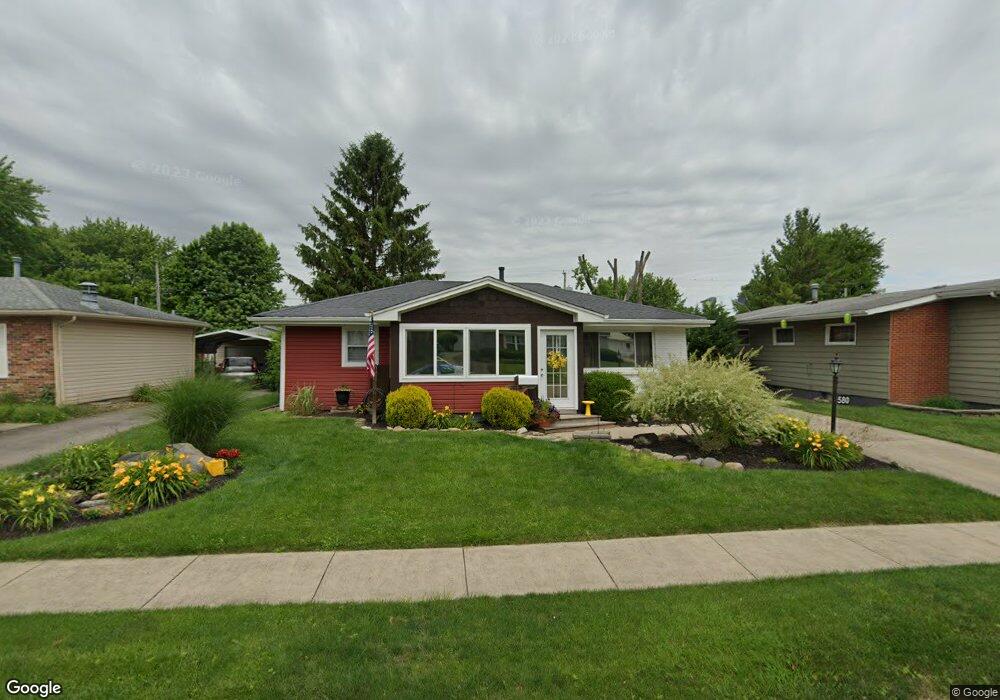
This home is located at 580 Marshall Dr, Xenia, OH 45385 and is currently estimated at $194,267, approximately $187 per square foot. 580 Marshall Dr is a home located in Greene County with nearby schools including Xenia High School, Summit Academy Community School for Alternative Learners - Xenia, and Legacy Christian Academy.
Ownership History
Date
Name
Owned For
Owner Type
Purchase Details
Closed on
Apr 14, 2011
Sold by
U S Bank National Association
Bought by
Neri Elden D and Neri Sharon I
Current Estimated Value
Home Financials for this Owner
Home Financials are based on the most recent Mortgage that was taken out on this home.
Original Mortgage
$35,000
Outstanding Balance
$24,214
Interest Rate
4.86%
Mortgage Type
New Conventional
Estimated Equity
$170,053
Purchase Details
Closed on
Mar 24, 2010
Sold by
Yates Dennis L and Yates Mary L
Bought by
U S Bank National Association
Purchase Details
Closed on
Apr 27, 2001
Sold by
Kress Wanda M and Kress Wanda
Bought by
Yates Dennis L and Yates Mary L
Home Financials for this Owner
Home Financials are based on the most recent Mortgage that was taken out on this home.
Original Mortgage
$86,769
Interest Rate
7.02%
Mortgage Type
FHA
Create a Home Valuation Report for This Property
The Home Valuation Report is an in-depth analysis detailing your home's value as well as a comparison with similar homes in the area
Home Values in the Area
Average Home Value in this Area
Purchase History
| Date | Buyer | Sale Price | Title Company |
|---|---|---|---|
| Neri Elden D | $62,000 | Prism Title & Closing Servic | |
| U S Bank National Association | $60,000 | Attorney | |
| Yates Dennis L | $87,900 | Sterling Title Inc |
Source: Public Records
Mortgage History
| Date | Status | Borrower | Loan Amount |
|---|---|---|---|
| Open | Neri Elden D | $35,000 | |
| Previous Owner | Yates Dennis L | $86,769 |
Source: Public Records
Tax History Compared to Growth
Tax History
| Year | Tax Paid | Tax Assessment Tax Assessment Total Assessment is a certain percentage of the fair market value that is determined by local assessors to be the total taxable value of land and additions on the property. | Land | Improvement |
|---|---|---|---|---|
| 2024 | $1,538 | $46,690 | $9,020 | $37,670 |
| 2023 | $1,538 | $46,690 | $9,020 | $37,670 |
| 2022 | $1,252 | $34,350 | $5,640 | $28,710 |
| 2021 | $1,269 | $34,350 | $5,640 | $28,710 |
| 2020 | $1,214 | $34,350 | $5,640 | $28,710 |
| 2019 | $1,290 | $34,350 | $5,790 | $28,560 |
| 2018 | $1,295 | $34,350 | $5,790 | $28,560 |
| 2017 | $1,129 | $34,350 | $5,790 | $28,560 |
| 2016 | $1,130 | $30,670 | $5,790 | $24,880 |
| 2015 | $1,133 | $30,670 | $5,790 | $24,880 |
| 2014 | $1,083 | $30,670 | $5,790 | $24,880 |
Source: Public Records
Map
Nearby Homes
- 513 Redbud Ln
- 508 Marshall Dr
- 610 Saxony Dr
- 656 Eden Roc Dr
- 568 Louise Dr
- 479 N Stadium Dr
- 348 S Stadium Dr
- 119 Park Dr
- 645 E Church St
- 659 N King St
- 612 E Market St
- 878 N Detroit St
- 902 N Detroit St
- 1038 Frederick Dr
- 516 N King St
- 214 Corwin Ave
- 1311 Eagles Way
- 137 Pleasant St
- 607 E Main St
- 541 E Main St
- 568 Marshall Dr
- 588 Marshall Dr
- 554 Marshall Dr
- 529 Redbud Ln
- 608 Marshall Dr
- 545 Redbud Ln
- 542 Marshall Dr
- 561 Redbud Ln
- 585 Marshall Dr
- 573 Marshall Dr
- 630 Marshall Dr
- 559 Marshall Dr
- 597 Marshall Dr
- 497 Redbud Ln
- 532 Marshall Dr
- 551 Marshall Dr
- 607 Marshall Dr
- 646 Marshall Dr
- 537 Marshall Dr
- 483 Redbud Ln