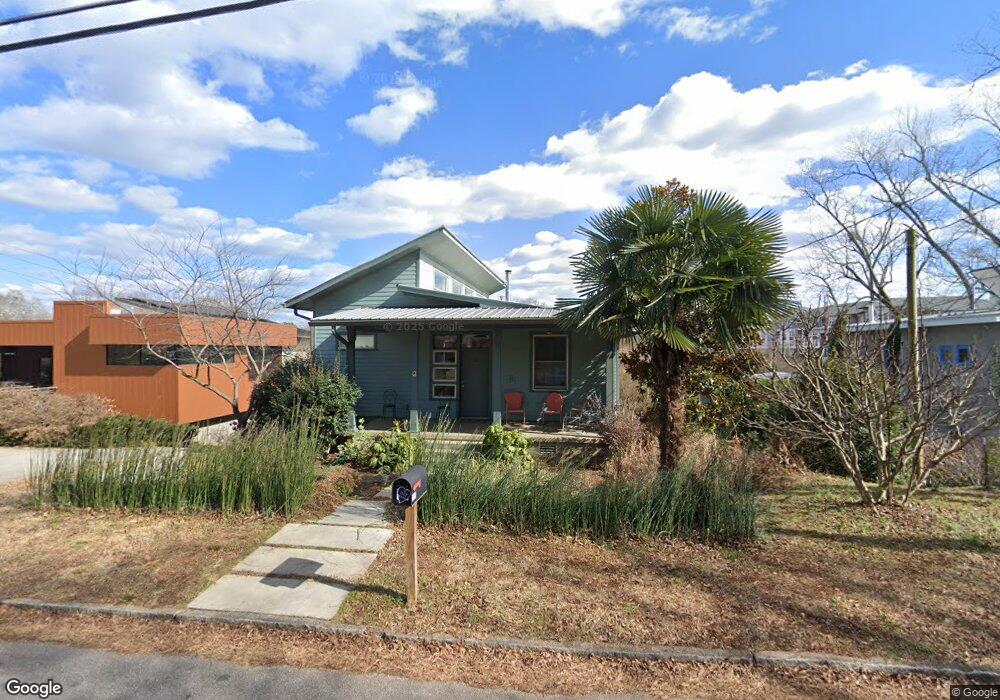
580 Pulaski St Athens, GA 30601
Newtown NeighborhoodEstimated Value: $619,000 - $801,000
--
Bed
--
Bath
2,420
Sq Ft
$304/Sq Ft
Est. Value
About This Home
This home is located at 580 Pulaski St, Athens, GA 30601 and is currently estimated at $736,192, approximately $304 per square foot. 580 Pulaski St is a home with nearby schools including Barrow Elementary School, Clarke Middle School, and Clarke Central High School.
Ownership History
Date
Name
Owned For
Owner Type
Purchase Details
Closed on
Aug 30, 2011
Sold by
Steinmetz Mark
Bought by
Morang Sarah G
Current Estimated Value
Purchase Details
Closed on
Apr 29, 2011
Sold by
Chief Springs East I Llc
Bought by
Steinmetz Mark
Purchase Details
Closed on
Oct 15, 2009
Sold by
Puleo Susan L
Bought by
Springs East I
Purchase Details
Closed on
Feb 28, 2006
Sold by
Not Provided
Bought by
Steinmetz Mark
Purchase Details
Closed on
Feb 22, 2002
Sold by
Bird Milton
Bought by
Puleo Susan
Purchase Details
Closed on
Sep 22, 1992
Sold by
Fleming Homer C
Bought by
Bird Milton
Create a Home Valuation Report for This Property
The Home Valuation Report is an in-depth analysis detailing your home's value as well as a comparison with similar homes in the area
Home Values in the Area
Average Home Value in this Area
Purchase History
| Date | Buyer | Sale Price | Title Company |
|---|---|---|---|
| Morang Sarah G | $84,000 | -- | |
| Steinmetz Mark | $79,400 | -- | |
| Springs East I | $115,000 | -- | |
| Springs East I | $80,000 | -- | |
| Springs East I | $80,000 | -- | |
| Springs East I | $80,000 | -- | |
| Steinmetz Mark | -- | -- | |
| Puleo Susan | $265,000 | -- | |
| Bird Milton | $30,000 | -- |
Source: Public Records
Tax History Compared to Growth
Tax History
| Year | Tax Paid | Tax Assessment Tax Assessment Total Assessment is a certain percentage of the fair market value that is determined by local assessors to be the total taxable value of land and additions on the property. | Land | Improvement |
|---|---|---|---|---|
| 2024 | $8,879 | $288,468 | $40,000 | $248,468 |
| 2023 | $8,515 | $268,081 | $40,000 | $228,081 |
| 2022 | $6,792 | $222,912 | $40,000 | $182,912 |
| 2021 | $6,200 | $193,966 | $40,000 | $153,966 |
| 2020 | $5,719 | $179,711 | $34,425 | $145,286 |
| 2019 | $5,326 | $166,881 | $34,425 | $132,456 |
| 2018 | $5,336 | $167,164 | $34,425 | $132,739 |
| 2017 | $5,073 | $159,428 | $34,425 | $125,003 |
| 2016 | $4,432 | $140,559 | $34,425 | $106,134 |
| 2015 | $4,715 | $138,672 | $34,425 | $104,247 |
| 2014 | $2,262 | $66,425 | $34,425 | $32,000 |
Source: Public Records
Map
Nearby Homes
- 600 Pulaski St
- 143 Barrow St
- 559 Pulaski St
- 668 Pulaski St
- 100 Prince Ave Unit A404
- 100 Prince Ave Unit A407
- 145 Hendrix Ave
- 570 Prince Ave
- 269 N Hull St Unit 212
- 257 Hill St
- 270 Atlanta Ave
- 250 W Broad St Unit 811
- 250 W Broad St Unit 521
- 697 Barber St
- 195 Beulah Ave
- 239 Madison Heights
- 198 Flint St
- 239 Ruth St Unit 15
- 249 Fifth St
- 552 Cobb St
- 580 Pulaski St Unit Lot 2
- 580 Pulaski St Unit Lot 3
- 580 Pulaski St Unit Lot 4
- 580 Pulaski St Unit Lot 1
- 582 Pulaski St
- 578 Pulaski St
- 595 Pulaski St
- 574 Pulaski St
- 579 Pulaski St
- 615 Pulaski St
- 568 Pulaski St
- 625 Pulaski St
- 630 Pulaski St
- 135 Barrow St
- 120 Barrow St
- 569 Pulaski St
- 564 Pulaski St
- 130 Barrow St
- 635 Pulaski St
- 566 Pulaski St