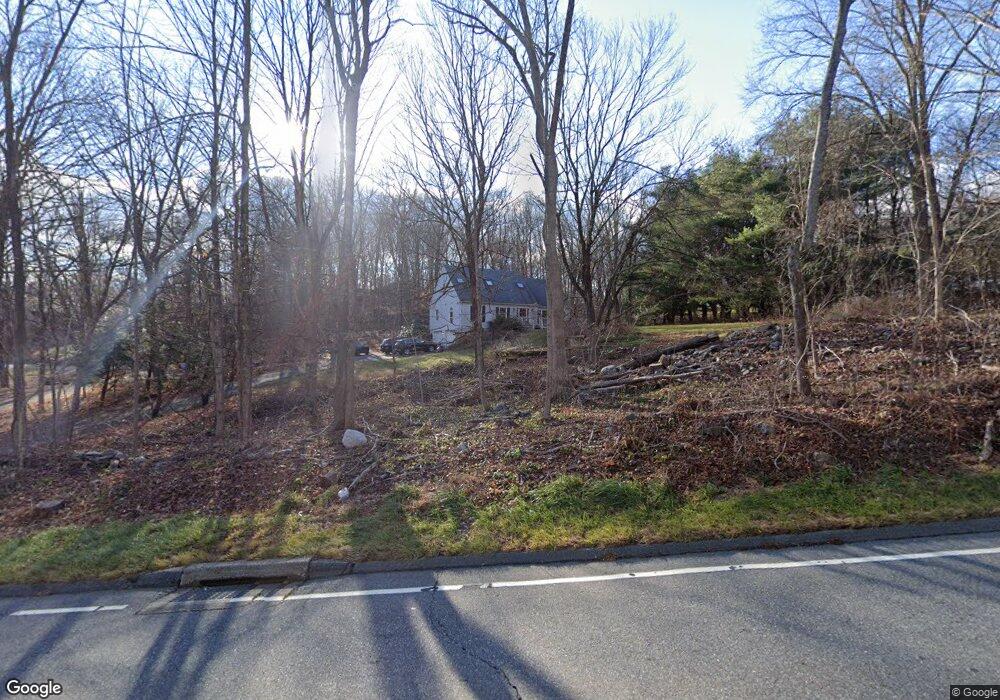
580 Route 87 Columbia, CT 06237
Estimated Value: $398,000 - $443,000
3
Beds
2
Baths
1,814
Sq Ft
$232/Sq Ft
Est. Value
About This Home
This home is located at 580 Route 87, Columbia, CT 06237 and is currently estimated at $421,583, approximately $232 per square foot. 580 Route 87 is a home located in Tolland County with nearby schools including Horace W. Porter School.
Ownership History
Date
Name
Owned For
Owner Type
Purchase Details
Closed on
Aug 2, 1999
Sold by
Martin Marguerite
Bought by
Lunt Richard and Lunt Susan
Current Estimated Value
Home Financials for this Owner
Home Financials are based on the most recent Mortgage that was taken out on this home.
Original Mortgage
$108,000
Interest Rate
4.75%
Purchase Details
Closed on
May 2, 1997
Sold by
Pouliot Christine and Pouliot Louis
Bought by
Martin Marguerite
Create a Home Valuation Report for This Property
The Home Valuation Report is an in-depth analysis detailing your home's value as well as a comparison with similar homes in the area
Home Values in the Area
Average Home Value in this Area
Purchase History
| Date | Buyer | Sale Price | Title Company |
|---|---|---|---|
| Lunt Richard | $160,250 | -- | |
| Martin Marguerite | $145,000 | -- |
Source: Public Records
Mortgage History
| Date | Status | Borrower | Loan Amount |
|---|---|---|---|
| Open | Martin Marguerite | $78,000 | |
| Closed | Martin Marguerite | $88,000 | |
| Closed | Martin Marguerite | $108,000 | |
| Previous Owner | Martin Marguerite | $107,000 |
Source: Public Records
Tax History Compared to Growth
Tax History
| Year | Tax Paid | Tax Assessment Tax Assessment Total Assessment is a certain percentage of the fair market value that is determined by local assessors to be the total taxable value of land and additions on the property. | Land | Improvement |
|---|---|---|---|---|
| 2025 | $5,665 | $193,550 | $40,530 | $153,020 |
| 2024 | $5,443 | $193,550 | $40,530 | $153,020 |
| 2023 | $5,015 | $193,550 | $40,530 | $153,020 |
| 2022 | $5,007 | $193,550 | $40,530 | $153,020 |
| 2021 | $4,273 | $145,700 | $36,700 | $109,000 |
| 2020 | $4,273 | $145,700 | $36,700 | $109,000 |
| 2019 | $4,273 | $145,700 | $36,700 | $109,000 |
| 2018 | $4,273 | $145,700 | $36,700 | $109,000 |
| 2017 | $4,208 | $145,700 | $36,700 | $109,000 |
| 2016 | $3,957 | $144,200 | $36,700 | $107,500 |
| 2015 | $3,912 | $144,200 | $36,700 | $107,500 |
| 2014 | $3,912 | $144,200 | $36,700 | $107,500 |
Source: Public Records
Map
Nearby Homes
- 65 Trumbull Hwy
- 103 Pine St
- 129 Pine St
- 146 Clubhouse Rd
- 22 Grandview Dr
- 55 Pine St
- 24 Grandview Dr
- 0 Chowanec Rd
- 517 Beaumont Hwy
- 4 Timber Trail
- 0 Trumbull Hwy Unit 24107184
- 24 Wildwood Dr
- 6 Hilltop Ln
- 757 Beaumont Hwy
- 111 Bascom Rd
- 0 Hunt Rd
- 76 Hunt Rd
- 22 Lake Ridge Dr
- 45 MacHt Rd
- 105 Lake Shore Dr