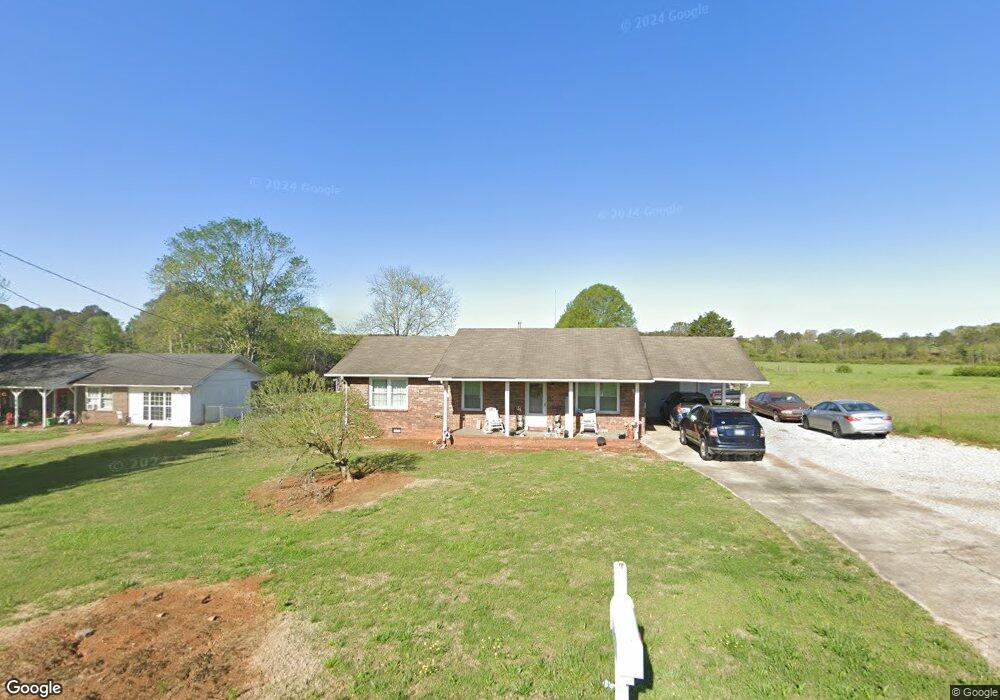
580 Substation Rd Cedartown, GA 30125
Estimated Value: $171,343 - $288,000
3
Beds
1
Bath
1,280
Sq Ft
$190/Sq Ft
Est. Value
About This Home
This home is located at 580 Substation Rd, Cedartown, GA 30125 and is currently estimated at $243,586, approximately $190 per square foot. 580 Substation Rd is a home located in Polk County.
Ownership History
Date
Name
Owned For
Owner Type
Purchase Details
Closed on
Mar 8, 1996
Sold by
Mitchell Lynn
Bought by
Dulaney Mary D
Current Estimated Value
Purchase Details
Closed on
Aug 18, 1995
Sold by
Juster John R and Cindy Ann
Bought by
Mitchell Lynn
Purchase Details
Closed on
Jan 28, 1982
Sold by
Farmers Home Admin
Bought by
Jester John and Jester Cinda
Purchase Details
Closed on
Jun 3, 1981
Sold by
Washington Kevin E
Bought by
Farmers Home Admin
Purchase Details
Closed on
Nov 25, 1980
Sold by
Farmers Home Admin
Bought by
Washington Kevin E
Purchase Details
Closed on
Feb 26, 1980
Sold by
Stough Jacy and Stough Edith
Bought by
Farmers Home Admin
Purchase Details
Closed on
Feb 9, 1979
Sold by
H R G Inc
Bought by
Stough Jacy and Stough Edith
Purchase Details
Closed on
May 2, 1978
Sold by
G & H Develop Co Inc
Bought by
H R G Inc
Purchase Details
Closed on
Mar 1, 1978
Bought by
G & H Develop Co Inc
Create a Home Valuation Report for This Property
The Home Valuation Report is an in-depth analysis detailing your home's value as well as a comparison with similar homes in the area
Home Values in the Area
Average Home Value in this Area
Purchase History
| Date | Buyer | Sale Price | Title Company |
|---|---|---|---|
| Dulaney Mary D | $45,300 | -- | |
| Mitchell Lynn | $12,500 | -- | |
| Jester John | -- | -- | |
| Farmers Home Admin | -- | -- | |
| Washington Kevin E | -- | -- | |
| Farmers Home Admin | -- | -- | |
| Stough Jacy | -- | -- | |
| H R G Inc | -- | -- | |
| G & H Develop Co Inc | -- | -- |
Source: Public Records
Tax History Compared to Growth
Tax History
| Year | Tax Paid | Tax Assessment Tax Assessment Total Assessment is a certain percentage of the fair market value that is determined by local assessors to be the total taxable value of land and additions on the property. | Land | Improvement |
|---|---|---|---|---|
| 2024 | $797 | $40,127 | $2,313 | $37,814 |
| 2023 | $584 | $26,613 | $2,313 | $24,300 |
| 2022 | $486 | $22,464 | $1,542 | $20,922 |
| 2021 | $492 | $22,464 | $1,542 | $20,922 |
| 2020 | $493 | $22,464 | $1,542 | $20,922 |
| 2019 | $538 | $22,039 | $1,542 | $20,497 |
| 2018 | $534 | $21,389 | $1,542 | $19,847 |
| 2017 | $522 | $21,184 | $1,542 | $19,642 |
| 2016 | $521 | $21,136 | $1,493 | $19,642 |
| 2015 | $529 | $21,391 | $1,493 | $19,898 |
| 2014 | $533 | $21,391 | $1,493 | $19,898 |
Source: Public Records
Map
Nearby Homes
- 387 Lindsey Chapel Rd
- 1522 Collard Valley Rd
- 2705 Collard Valley Rd
- 94 Wimberly Hill Loop
- 200 Kelly Rd
- 0 Richard Pullen Rd Unit 10577442
- 0 Richard Pullen Rd Unit 7626794
- 256 Cuzzort Rd
- 0 Benefield Rd Unit 7479734
- 0 Benefield Rd Unit 10405501
- 0 Blanche Rd Unit 10609468
- 0 Blanche Rd Unit 7652978
- 536 Wimberly Hill Rd
- 3323 Rockmart Hwy
- 728 Hutto Rd
- 660 Valley Rd
- 645 Valley Rd
- 618 Valley Rd
- 662 Hillside Dr
- 12 Breckenridge Dr
- 579 Substation Rd
- 569 Substation Rd
- 603 Substation Rd
- 559 Substation Rd
- 633 Substation Rd
- 540 Substation Rd
- 677 Substation Rd
- 687 Substation Rd
- 536 Substation Rd
- 697 Substation Rd
- 707 Substation Rd
- 0 Substation Rd Unit 7301169
- 0 Substation Rd Unit 8799712
- 0 Substation Rd
- 534 Substation Rd
- 430 Substation Rd
- 838 Substation Rd
- 298 Substation Rd
- 1750 Collard Valley Rd
- 552 Lindsey Chapel Rd