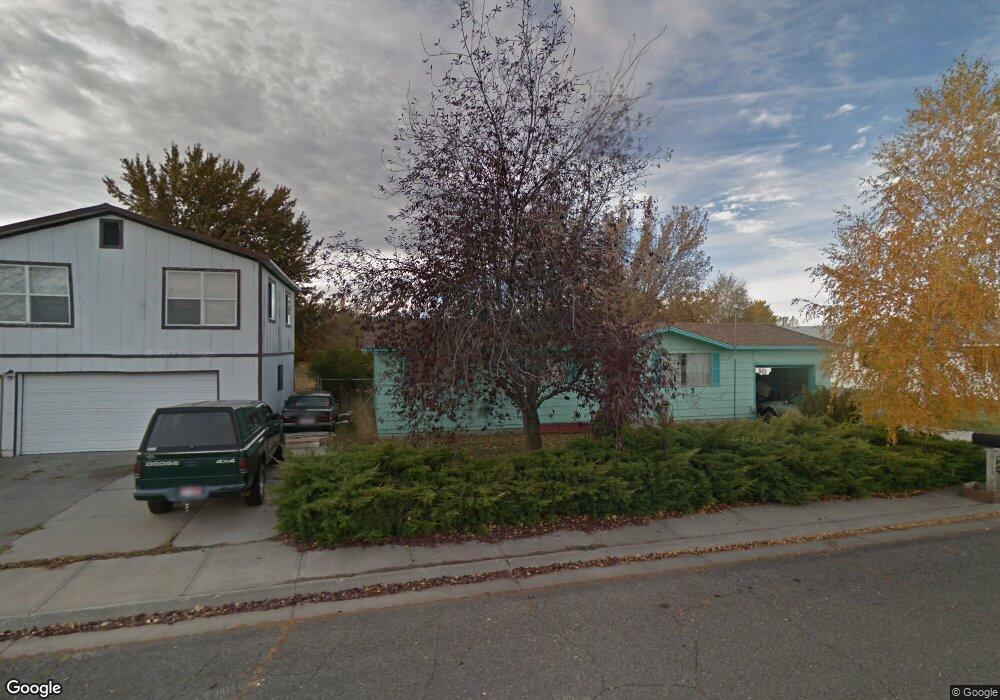
580 Sunset St Saint Anthony, ID 83445
Estimated Value: $264,007 - $287,000
3
Beds
1
Bath
1,056
Sq Ft
$265/Sq Ft
Est. Value
About This Home
This home is located at 580 Sunset St, Saint Anthony, ID 83445 and is currently estimated at $279,752, approximately $264 per square foot. 580 Sunset St is a home located in Fremont County with nearby schools including Henrys Fork Elementary School, South Fremont Junior High School, and South Fremont High School.
Ownership History
Date
Name
Owned For
Owner Type
Purchase Details
Closed on
Sep 8, 2015
Sold by
Nationstar Mortgage Llc
Bought by
Harris Lorin F and Harris Cathy S
Current Estimated Value
Purchase Details
Closed on
Mar 20, 2015
Sold by
Gosnell Wesley R and Gosnell Carol E
Bought by
Nationstar Mortgage Llc
Purchase Details
Closed on
Sep 30, 2014
Sold by
Gosnell Wesley R and Gosnell Carol E
Bought by
Nationstar Mortgage Llc
Create a Home Valuation Report for This Property
The Home Valuation Report is an in-depth analysis detailing your home's value as well as a comparison with similar homes in the area
Home Values in the Area
Average Home Value in this Area
Purchase History
| Date | Buyer | Sale Price | Title Company |
|---|---|---|---|
| Harris Lorin F | -- | Pioneer Title | |
| Nationstar Mortgage Llc | $72,000 | None Available | |
| Nationstar Mortgage Llc | $72,000 | None Available |
Source: Public Records
Tax History
| Year | Tax Paid | Tax Assessment Tax Assessment Total Assessment is a certain percentage of the fair market value that is determined by local assessors to be the total taxable value of land and additions on the property. | Land | Improvement |
|---|---|---|---|---|
| 2025 | $1,795 | $203,981 | $22,688 | $181,293 |
| 2024 | $1,812 | $197,761 | $22,688 | $175,073 |
| 2023 | $1,909 | $197,761 | $22,688 | $175,073 |
| 2022 | $2,029 | $164,415 | $22,688 | $141,727 |
| 2021 | $2,118 | $136,113 | $18,563 | $117,550 |
| 2020 | $2,158 | $129,443 | $18,563 | $110,880 |
| 2019 | $2,051 | $123,095 | $18,563 | $104,532 |
| 2018 | $1,953 | $109,734 | $18,563 | $91,171 |
| 2017 | $19 | $91,100 | $18,006 | $73,094 |
| 2016 | $1,846 | $91,100 | $18,006 | $73,094 |
| 2015 | $1,053 | $91,100 | $0 | $0 |
| 2014 | $707 | $45,548 | $0 | $0 |
| 2013 | $707 | $45,548 | $0 | $0 |
Source: Public Records
Map
Nearby Homes
- 595 Bechler St
- 415 Juniper View Ave
- 545 Elm Ave Unit 18
- 645 W 1st N
- TBD 8th St
- 2985 Edgewater Ln
- 745 W Main St
- 1112 Home Run Ave
- 238 W Main St
- 206 E 3rd N
- 718 W 2nd S
- 247 N 3rd E
- 235 W 6th S
- 436 W 7th S
- Appx 730 Radio Rd
- 2391 E 465 N
- TBD 2511 Del Rio Way
- 130 Industrial Park Rd
- 120 Industrial Park Rd
- 2310 E Trails End
Your Personal Tour Guide
Ask me questions while you tour the home.