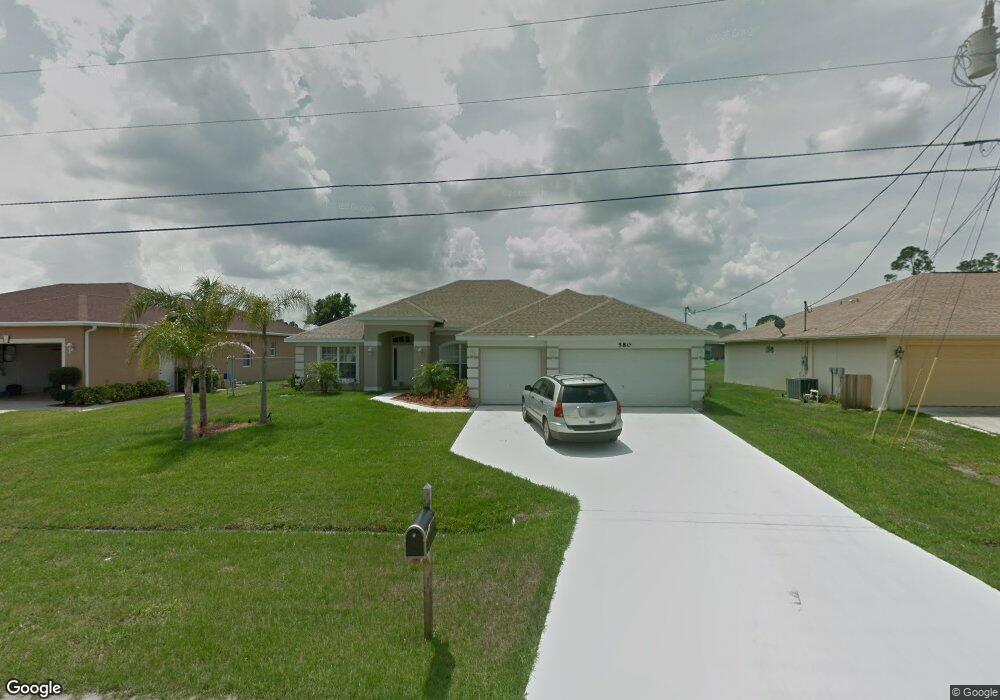
580 SW Dagget Ave Port Saint Lucie, FL 34953
Tulip Park NeighborhoodEstimated Value: $491,000 - $580,000
4
Beds
3
Baths
2,285
Sq Ft
$232/Sq Ft
Est. Value
About This Home
This home is located at 580 SW Dagget Ave, Port Saint Lucie, FL 34953 and is currently estimated at $529,967, approximately $231 per square foot. 580 SW Dagget Ave is a home with nearby schools including Windmill Point Elementary School, Oak Hammock K-8 School, and Bayshore Elementary School.
Ownership History
Date
Name
Owned For
Owner Type
Purchase Details
Closed on
Nov 6, 2015
Sold by
Palmer John Thomas Richard
Bought by
Palmer Ii John Thomas Richard and Palmer Terri A
Current Estimated Value
Home Financials for this Owner
Home Financials are based on the most recent Mortgage that was taken out on this home.
Original Mortgage
$236,700
Outstanding Balance
$186,806
Interest Rate
3.89%
Mortgage Type
VA
Estimated Equity
$343,161
Purchase Details
Closed on
Aug 9, 2010
Sold by
Adams Homes Of Northwest Florida Inc
Bought by
Palmer Ii John Thomas Richard
Home Financials for this Owner
Home Financials are based on the most recent Mortgage that was taken out on this home.
Original Mortgage
$182,442
Interest Rate
5.5%
Mortgage Type
FHA
Purchase Details
Closed on
Apr 19, 2002
Sold by
Torres Anna H
Bought by
Tan Seng-Chai
Purchase Details
Closed on
Oct 26, 1998
Sold by
Nationsbank Fl
Bought by
Torres Anna H
Create a Home Valuation Report for This Property
The Home Valuation Report is an in-depth analysis detailing your home's value as well as a comparison with similar homes in the area
Home Values in the Area
Average Home Value in this Area
Purchase History
| Date | Buyer | Sale Price | Title Company |
|---|---|---|---|
| Palmer Ii John Thomas Richard | $86,300 | Mortgage Connect Lp | |
| Palmer Ii John Thomas Richard | $184,900 | Sun Title Agency Llc | |
| Tan Seng-Chai | $3,800 | -- | |
| Torres Anna H | $18,600 | -- |
Source: Public Records
Mortgage History
| Date | Status | Borrower | Loan Amount |
|---|---|---|---|
| Open | Palmer Ii John Thomas Richard | $236,700 | |
| Closed | Palmer Ii John Thomas Richard | $182,442 |
Source: Public Records
Tax History Compared to Growth
Tax History
| Year | Tax Paid | Tax Assessment Tax Assessment Total Assessment is a certain percentage of the fair market value that is determined by local assessors to be the total taxable value of land and additions on the property. | Land | Improvement |
|---|---|---|---|---|
| 2024 | $3,562 | $183,079 | -- | -- |
| 2023 | $3,562 | $177,747 | $0 | $0 |
| 2022 | $3,414 | $172,570 | $0 | $0 |
| 2021 | $3,329 | $167,544 | $0 | $0 |
| 2020 | $3,345 | $165,231 | $0 | $0 |
| 2019 | $3,309 | $161,517 | $0 | $0 |
| 2018 | $3,143 | $158,506 | $0 | $0 |
| 2017 | $3,327 | $216,600 | $28,000 | $188,600 |
| 2016 | $6,143 | $216,900 | $24,000 | $192,900 |
| 2015 | $3,311 | $178,400 | $14,400 | $164,000 |
| 2014 | $3,151 | $149,799 | $0 | $0 |
Source: Public Records
Map
Nearby Homes
- 565 SW Feldman Ave
- 579 SW Paar Dr
- 572 SW Mccomb Ave
- 509 SW Feldman Ave
- 3990 SW Halcomb St
- 3837 SW Daisy St
- 435 SW Fields Ave
- 662 SW Jacoby Ave
- 3874 SW Kasin St
- 514 SW Lakota Ave
- 543 SW Kabot Ave
- 3965 SW Mccain St
- 3998 SW Mccain St
- 691 SW Mccomb Ave
- 467 SW Lakota Ave
- 418 SW Fields Ave
- 413 SW Mccomb Ave
- 514 SW Kabot Ave
- 372 SW Feldman Ave
- 766 SW Mccullough Ave
- 590 SW Dagget Ave
- 570 SW Dagget Ave
- 560 SW Dagget Ave
- 598 SW Dagget Ave
- 3898 SW Hall St
- 565 SW Dahled Ave
- 3897 SW Hale St
- 000 Darwin Blvd
- 573 SW Dahled Ave
- 550 SW Dagget Ave
- 549 SW Dahled Ave
- 3874 SW Hall St
- 571 SW Dagget Ave
- 581 SW Dahled Ave
- 3896 SW Hale St
- 3873 SW Hale St
- 541 SW Dahled Ave
- 557 SW Dagget Ave
- 540 SW Dagget Ave
- 3880 SW Hale St