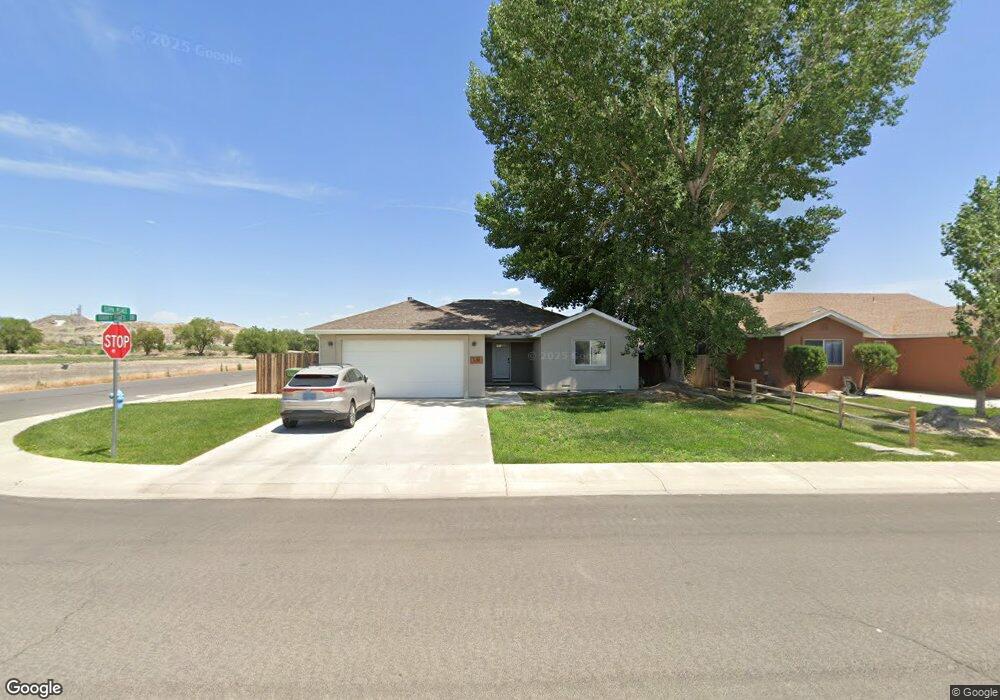
580 Torrey Pines Dr Fallon, NV 89406
Estimated Value: $385,021 - $410,000
3
Beds
2
Baths
1,753
Sq Ft
$225/Sq Ft
Est. Value
About This Home
This home is located at 580 Torrey Pines Dr, Fallon, NV 89406 and is currently estimated at $395,005, approximately $225 per square foot. 580 Torrey Pines Dr is a home located in Churchill County with nearby schools including E.C. Best Elementary School, Numa Elementary School, and Lahontan Elementary School.
Ownership History
Date
Name
Owned For
Owner Type
Purchase Details
Closed on
Sep 9, 2022
Sold by
Buckmaster Karl L
Bought by
Buckmaster Karl L and Buckmaster Jennifer E
Current Estimated Value
Home Financials for this Owner
Home Financials are based on the most recent Mortgage that was taken out on this home.
Original Mortgage
$155,000
Outstanding Balance
$148,049
Interest Rate
5.22%
Mortgage Type
Credit Line Revolving
Estimated Equity
$246,956
Purchase Details
Closed on
Apr 13, 2006
Sold by
Frey Colby and Buckmaster Jennifer E
Bought by
Buckmaster Karl L
Home Financials for this Owner
Home Financials are based on the most recent Mortgage that was taken out on this home.
Original Mortgage
$117,000
Interest Rate
6.2%
Purchase Details
Closed on
Jun 3, 2005
Sold by
Serpa Joann L
Bought by
Irish Land & Cattle Co
Purchase Details
Closed on
Jun 1, 2005
Sold by
Irish Land & Cattle Co
Bought by
Cabernet Investments Inc
Purchase Details
Closed on
Feb 16, 2005
Sold by
Cabernet Investments Inc
Bought by
Frey Colby and Buckmaster Karl L
Create a Home Valuation Report for This Property
The Home Valuation Report is an in-depth analysis detailing your home's value as well as a comparison with similar homes in the area
Home Values in the Area
Average Home Value in this Area
Purchase History
| Date | Buyer | Sale Price | Title Company |
|---|---|---|---|
| Buckmaster Karl L | -- | Western Nevada Title Agency | |
| Buckmaster Karl L | $118,000 | Western Nevada Title Company | |
| Irish Land & Cattle Co | $57,600 | Western Nevada Title Company | |
| Cabernet Investments Inc | $160,000 | Western Nevada Title Company | |
| Frey Colby | $236,150 | Western Nevada Title Company |
Source: Public Records
Mortgage History
| Date | Status | Borrower | Loan Amount |
|---|---|---|---|
| Open | Buckmaster Karl L | $155,000 | |
| Previous Owner | Buckmaster Karl L | $117,000 |
Source: Public Records
Tax History Compared to Growth
Tax History
| Year | Tax Paid | Tax Assessment Tax Assessment Total Assessment is a certain percentage of the fair market value that is determined by local assessors to be the total taxable value of land and additions on the property. | Land | Improvement |
|---|---|---|---|---|
| 2025 | $2,886 | $91,368 | $21,700 | $69,668 |
| 2024 | $2,886 | $90,043 | $19,950 | $70,093 |
| 2023 | $2,886 | $85,594 | $19,950 | $65,644 |
| 2022 | $2,474 | $70,004 | $13,300 | $56,704 |
| 2021 | $2,275 | $67,838 | $13,300 | $54,538 |
| 2020 | $2,192 | $68,889 | $13,300 | $55,589 |
| 2019 | $2,117 | $67,308 | $13,300 | $54,008 |
| 2018 | $2,020 | $65,966 | $13,300 | $52,666 |
| 2017 | $1,939 | $63,828 | $11,200 | $52,628 |
| 2016 | $1,889 | $56,196 | $8,400 | $47,796 |
| 2015 | $1,853 | $50,750 | $8,400 | $42,350 |
| 2014 | $1,802 | $46,939 | $8,400 | $38,539 |
Source: Public Records
Map
Nearby Homes
- 489 Torrey Pines Dr
- 937 Woodhaven Dr
- 760 Augusta Ln
- 1215 Green Valley Dr
- 604 Serpa Place
- 00 Serpa Place
- 667 Keppel St
- 305 Cemetery Rd
- Off of Maine St 6 Acres
- 160 N Broadway St
- 125 N Broadway St
- 155 N Maine St
- 337 Court St
- 776 Great Basin Ln
- 874 Great Basin Ln
- 866 Great Basin Ln
- 25590 Austin Hwy
- Off of Maine St 10 68 Acres
- 830 E Stillwater Ave Unit 15
- 414 Discovery Dr
- 568 Torrey Pines Dr
- 595 Cicada St
- 550 Torrey Pines Dr
- 583 Torrey Pines Dr
- 571 Cicada St
- 573 Torrey Pines Dr
- 534 Torrey Pines Dr
- 555 Torrey Pines Dr
- 559 Cicada St
- 537 Torrey Pines Dr
- 598 Cicada St
- 588 Cicada St
- 547 Cicada St
- 519 Torrey Pines Dr
- 576 Cicada St
- 496 Torrey Pines Dr
- 566 Cicada St
- 535 Cicada St
- 501 Torrey Pines Dr