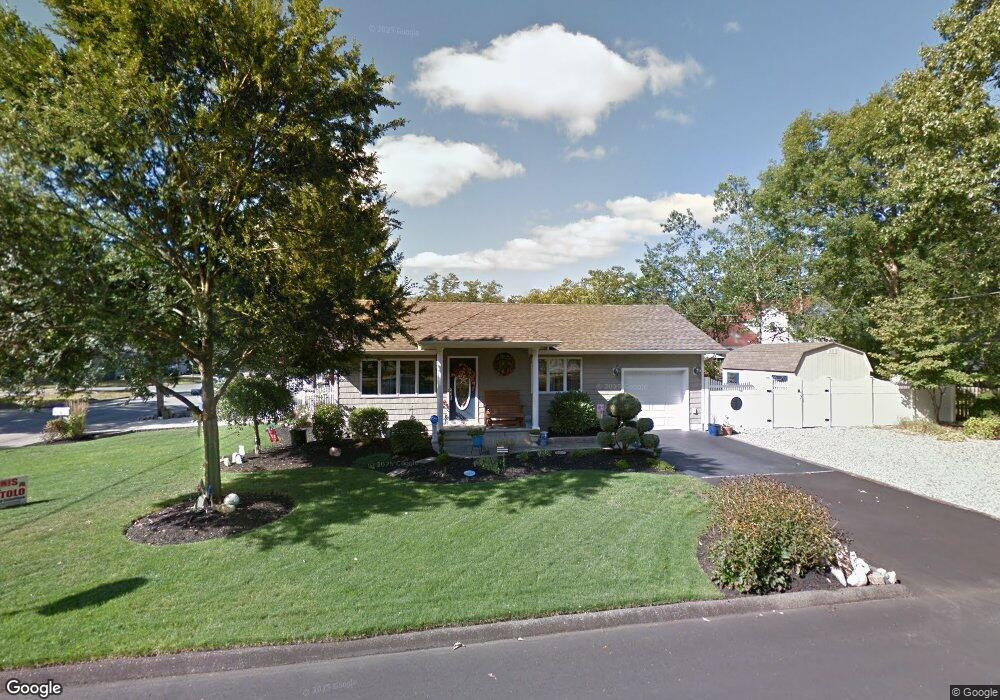
580 Vaughn Ave Forked River, NJ 08731
Estimated Value: $315,959 - $351,000
2
Beds
1
Bath
892
Sq Ft
$375/Sq Ft
Est. Value
About This Home
This home is located at 580 Vaughn Ave, Forked River, NJ 08731 and is currently estimated at $334,740, approximately $375 per square foot. 580 Vaughn Ave is a home located in Ocean County with nearby schools including Lacey Township High School.
Ownership History
Date
Name
Owned For
Owner Type
Purchase Details
Closed on
Oct 18, 2022
Sold by
Smolens Dorene M
Bought by
Smolens Dorene M and Klink Jeffrey D
Current Estimated Value
Purchase Details
Closed on
May 22, 1998
Sold by
Woolley Robert and Devincens Esq Douglas M
Bought by
Smolens Dorene M
Home Financials for this Owner
Home Financials are based on the most recent Mortgage that was taken out on this home.
Original Mortgage
$73,211
Interest Rate
7.11%
Mortgage Type
FHA
Purchase Details
Closed on
Dec 18, 1997
Sold by
Salomon Brothers Realty Corp
Bought by
Woolley Robert
Home Financials for this Owner
Home Financials are based on the most recent Mortgage that was taken out on this home.
Original Mortgage
$43,890
Interest Rate
7.09%
Purchase Details
Closed on
Jun 19, 1997
Sold by
Labella Eileen
Bought by
Salomon Brothers Realty Corp
Create a Home Valuation Report for This Property
The Home Valuation Report is an in-depth analysis detailing your home's value as well as a comparison with similar homes in the area
Home Values in the Area
Average Home Value in this Area
Purchase History
| Date | Buyer | Sale Price | Title Company |
|---|---|---|---|
| Smolens Dorene M | -- | -- | |
| Smolens Dorene M | -- | None Listed On Document | |
| Smolens Dorene M | $74,000 | Transnation Title Insurance | |
| Woolley Robert | $54,862 | -- | |
| Salomon Brothers Realty Corp | -- | -- |
Source: Public Records
Mortgage History
| Date | Status | Borrower | Loan Amount |
|---|---|---|---|
| Previous Owner | Smolens Dorene M | $73,211 | |
| Previous Owner | Woolley Robert | $43,890 |
Source: Public Records
Tax History
| Year | Tax Paid | Tax Assessment Tax Assessment Total Assessment is a certain percentage of the fair market value that is determined by local assessors to be the total taxable value of land and additions on the property. | Land | Improvement |
|---|---|---|---|---|
| 2025 | $4,146 | $151,600 | $62,700 | $88,900 |
| 2024 | $3,591 | $151,600 | $62,700 | $88,900 |
| 2023 | $3,431 | $151,600 | $62,700 | $88,900 |
| 2022 | $3,431 | $151,600 | $62,700 | $88,900 |
| 2021 | $3,373 | $151,600 | $62,700 | $88,900 |
| 2020 | $3,265 | $151,600 | $62,700 | $88,900 |
| 2019 | $3,208 | $151,600 | $62,700 | $88,900 |
| 2018 | $3,170 | $151,600 | $62,700 | $88,900 |
| 2017 | $3,097 | $151,600 | $62,700 | $88,900 |
| 2016 | $3,085 | $151,600 | $62,700 | $88,900 |
| 2015 | $2,947 | $130,500 | $62,700 | $67,800 |
| 2014 | $2,494 | $145,000 | $96,000 | $49,000 |
Source: Public Records
Map
Nearby Homes
- 584 Vaughn Ave
- 600 Lakeside Dr N
- 546 Lakeside Dr N
- 535 Baldwin St
- 603 Baldwin St
- 602 Lakeside Dr N
- 602 Baldwin St
- 607 Baldwin St
- 575 Vaughn Ave
- 603 Lakeside Dr N
- 544 Lakeside Dr N
- 536 Baldwin St
- 608 Baldwin St
- 549 Lakeside Dr N
- 609 Lakeside Dr N
- 543 Lakeside Dr N
- 610 Lakeside Dr N
- 610 Baldwin St
- 590 Vaughn Ave
- 541 Lakeside Dr N
Your Personal Tour Guide
Ask me questions while you tour the home.