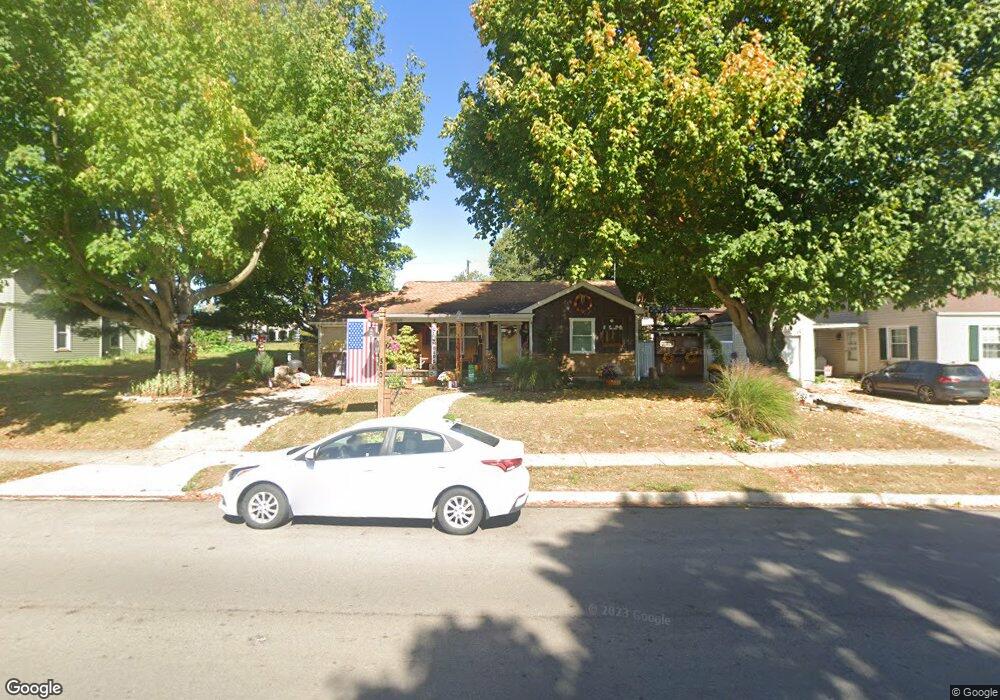
580 Washington Ave Urbana, OH 43078
Estimated Value: $164,000 - $194,000
3
Beds
1
Bath
982
Sq Ft
$186/Sq Ft
Est. Value
About This Home
This home is located at 580 Washington Ave, Urbana, OH 43078 and is currently estimated at $182,404, approximately $185 per square foot. 580 Washington Ave is a home located in Champaign County with nearby schools including Urbana Elementary School, Urbana High School, and Urbana Community School.
Ownership History
Date
Name
Owned For
Owner Type
Purchase Details
Closed on
Oct 19, 2020
Sold by
Lingrell William Andrew and Padilla Lingrell Gina
Bought by
Lingrell William Andrew and Padilla Lingrell Gina
Current Estimated Value
Purchase Details
Closed on
Jul 11, 2008
Sold by
Smith Linda Kay and Dundon John R
Bought by
Lingrell William Andrew and Lingrell William A
Home Financials for this Owner
Home Financials are based on the most recent Mortgage that was taken out on this home.
Original Mortgage
$83,588
Outstanding Balance
$54,143
Interest Rate
6.15%
Mortgage Type
FHA
Estimated Equity
$128,261
Purchase Details
Closed on
Mar 24, 2008
Sold by
Snapp Deena and Snapp Douglas
Bought by
Smith Linda Kay and Dundon John R
Purchase Details
Closed on
Jan 4, 2006
Sold by
Estate Of Robert J Dundon
Bought by
Dundon John R and Smith Linda Kay
Create a Home Valuation Report for This Property
The Home Valuation Report is an in-depth analysis detailing your home's value as well as a comparison with similar homes in the area
Home Values in the Area
Average Home Value in this Area
Purchase History
| Date | Buyer | Sale Price | Title Company |
|---|---|---|---|
| Lingrell William Andrew | -- | None Available | |
| Lingrell William Andrew | $42,450 | Attorney | |
| Smith Linda Kay | -- | Attorney | |
| Dundon John R | -- | None Available |
Source: Public Records
Mortgage History
| Date | Status | Borrower | Loan Amount |
|---|---|---|---|
| Open | Lingrell William Andrew | $83,588 |
Source: Public Records
Tax History Compared to Growth
Tax History
| Year | Tax Paid | Tax Assessment Tax Assessment Total Assessment is a certain percentage of the fair market value that is determined by local assessors to be the total taxable value of land and additions on the property. | Land | Improvement |
|---|---|---|---|---|
| 2024 | $1,508 | $36,660 | $9,170 | $27,490 |
| 2023 | $1,508 | $36,660 | $9,170 | $27,490 |
| 2022 | $1,538 | $36,660 | $9,170 | $27,490 |
| 2021 | $1,434 | $30,290 | $7,310 | $22,980 |
| 2020 | $1,434 | $30,290 | $7,310 | $22,980 |
| 2019 | $1,416 | $30,290 | $7,310 | $22,980 |
| 2018 | $1,129 | $23,050 | $4,910 | $18,140 |
| 2017 | $1,121 | $23,050 | $4,910 | $18,140 |
| 2016 | $1,124 | $23,050 | $4,910 | $18,140 |
| 2015 | $1,119 | $22,260 | $4,910 | $17,350 |
| 2014 | $1,120 | $22,260 | $4,910 | $17,350 |
| 2013 | $953 | $22,260 | $4,910 | $17,350 |
Source: Public Records
Map
Nearby Homes
- 522 E Ward St
- 501 Boyce St
- 603 E Light St
- 819 Boyce St
- 501 E Light St
- 429 E Court St
- 206 Lincoln Place
- 412 N Main St
- 312 E Water St
- 851 Crescent Dr
- 242 Laurel Oak St
- 860 Amherst Dr
- 234 Laurel Oak St
- 241 Louden St
- 0 Laurel Oak St Unit 1038292
- 0 S Kenton St Unit 1039146
- 0 S Kenton St Unit 225020232
- 311 W Church St
- 588 Washington Ave
- 574 Washington Ave
- 572 Washington Ave
- 596 Washington Ave
- 500 E Lawn Ave
- 514 E Lawn Ave
- 556 Washington Ave
- 520 E Lawn Ave
- 581 Washington Ave
- 573 Washington Ave
- 589 Washington Ave
- 597 Washington Ave
- 569 Washington Ave
- 550 Washington Ave
- 503 E Lawn Ave
- 509 E Lawn Ave
- 565 Washington Ave
- 530 E Lawn Ave
- 563 Washington Ave
- 418 E Lawn Ave