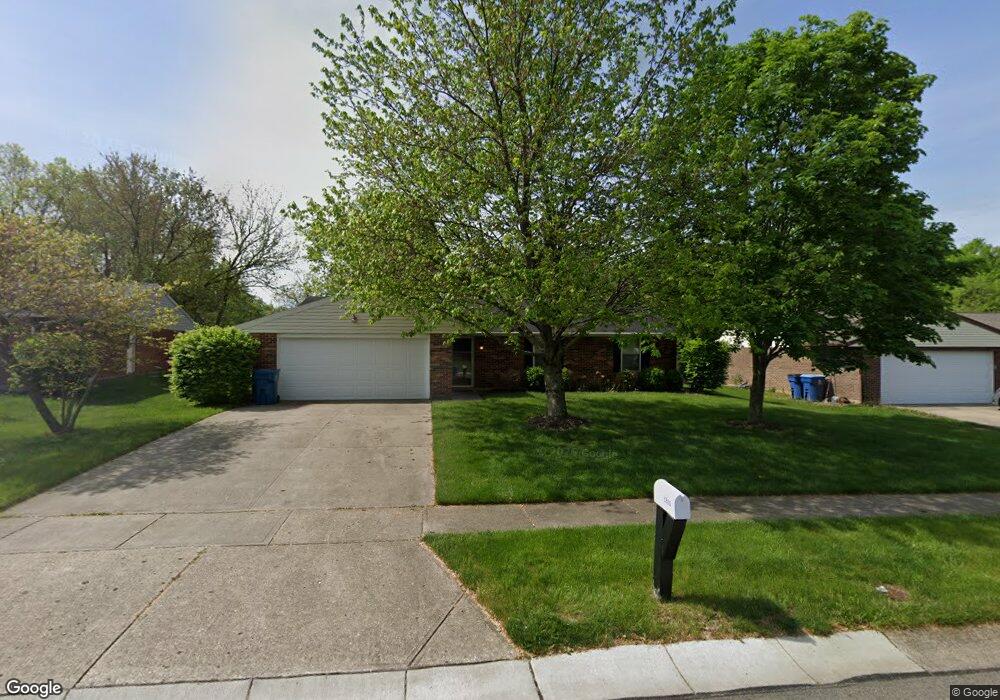
5800 Charlesgate Rd Dayton, OH 45424
Estimated Value: $215,078 - $236,000
3
Beds
2
Baths
1,339
Sq Ft
$169/Sq Ft
Est. Value
About This Home
This home is located at 5800 Charlesgate Rd, Dayton, OH 45424 and is currently estimated at $226,520, approximately $169 per square foot. 5800 Charlesgate Rd is a home located in Montgomery County with nearby schools including Wayne High School and Huber Heights Christian Academy.
Ownership History
Date
Name
Owned For
Owner Type
Purchase Details
Closed on
May 21, 2022
Sold by
Walker Ken A and Walker Nicole
Bought by
Wiley David D
Current Estimated Value
Purchase Details
Closed on
Aug 30, 2011
Sold by
Fultz Brian J and Fultz Amanda M
Bought by
Walker Ken A
Home Financials for this Owner
Home Financials are based on the most recent Mortgage that was taken out on this home.
Original Mortgage
$108,000
Interest Rate
3.87%
Mortgage Type
Adjustable Rate Mortgage/ARM
Purchase Details
Closed on
May 31, 2006
Sold by
Myers Marcia L
Bought by
Fultz Brian J
Home Financials for this Owner
Home Financials are based on the most recent Mortgage that was taken out on this home.
Original Mortgage
$95,900
Interest Rate
6.68%
Mortgage Type
Purchase Money Mortgage
Purchase Details
Closed on
Jun 4, 1996
Sold by
Martin Denise A
Bought by
Myers Marcia L
Create a Home Valuation Report for This Property
The Home Valuation Report is an in-depth analysis detailing your home's value as well as a comparison with similar homes in the area
Home Values in the Area
Average Home Value in this Area
Purchase History
| Date | Buyer | Sale Price | Title Company |
|---|---|---|---|
| Wiley David D | $11,333 | Ruffolo John M | |
| Walker Ken A | $120,000 | Attorney | |
| Fultz Brian J | $119,900 | None Available | |
| Myers Marcia L | $96,900 | -- |
Source: Public Records
Mortgage History
| Date | Status | Borrower | Loan Amount |
|---|---|---|---|
| Previous Owner | Walker Ken A | $108,000 | |
| Previous Owner | Fultz Brian J | $95,900 |
Source: Public Records
Tax History Compared to Growth
Tax History
| Year | Tax Paid | Tax Assessment Tax Assessment Total Assessment is a certain percentage of the fair market value that is determined by local assessors to be the total taxable value of land and additions on the property. | Land | Improvement |
|---|---|---|---|---|
| 2024 | $2,885 | $54,390 | $14,910 | $39,480 |
| 2023 | $2,885 | $54,390 | $14,910 | $39,480 |
| 2022 | $2,504 | $38,300 | $10,500 | $27,800 |
| 2021 | $2,549 | $38,300 | $10,500 | $27,800 |
| 2020 | $2,551 | $38,300 | $10,500 | $27,800 |
| 2019 | $2,608 | $34,650 | $10,500 | $24,150 |
| 2018 | $2,616 | $34,650 | $10,500 | $24,150 |
| 2017 | $2,599 | $34,650 | $10,500 | $24,150 |
| 2016 | $2,604 | $33,830 | $10,500 | $23,330 |
| 2015 | $2,571 | $33,830 | $10,500 | $23,330 |
| 2014 | $2,571 | $33,830 | $10,500 | $23,330 |
| 2012 | -- | $37,750 | $10,500 | $27,250 |
Source: Public Records
Map
Nearby Homes
- 5901 Timbergate Trail
- 5660 Shull Rd
- 8948 Autumngate Ln
- 8436 Indian Mound Dr
- 6117 Charlesgate Rd
- 8554 Schoolgate Dr
- 6089 Green Knolls Dr
- 8671 Pinegate Way
- 4957 Country Park Dr
- 6219 Beacon Tree Ct
- 8041 Bushclover Dr
- 4676 Cobblestone Dr Unit 4676
- 4704 Cobblestone Dr Unit 4704
- 8830 Christygate Ln
- 8133 Bushclover Dr
- 6334 Shull Rd
- 4620 Cobblestone Dr Unit 4620
- 3109 Coneflower Dr
- 8930 Century Ln
- 2003 Trillium Way
- 5790 Charlesgate Rd
- 5810 Charlesgate Rd
- 5780 Charlesgate Rd
- 5820 Charlesgate Rd
- 8840 Swinging Gate Dr
- 5807 Charlesgate Rd
- 5770 Charlesgate Rd
- 5817 Charlesgate Rd
- 8850 Swinging Gate Dr
- 5827 Charlesgate Rd
- 8841 Swinging Gate Dr
- 5760 Charlesgate Rd
- 5830 Charlesgate Rd
- 5812 Stonegate Ct
- 8860 Swinging Gate Dr
- 5837 Charlesgate Rd
- 5822 Stonegate Ct
- 8851 Swinging Gate Dr
- 5750 Charlesgate Rd
- 5840 Charlesgate Rd