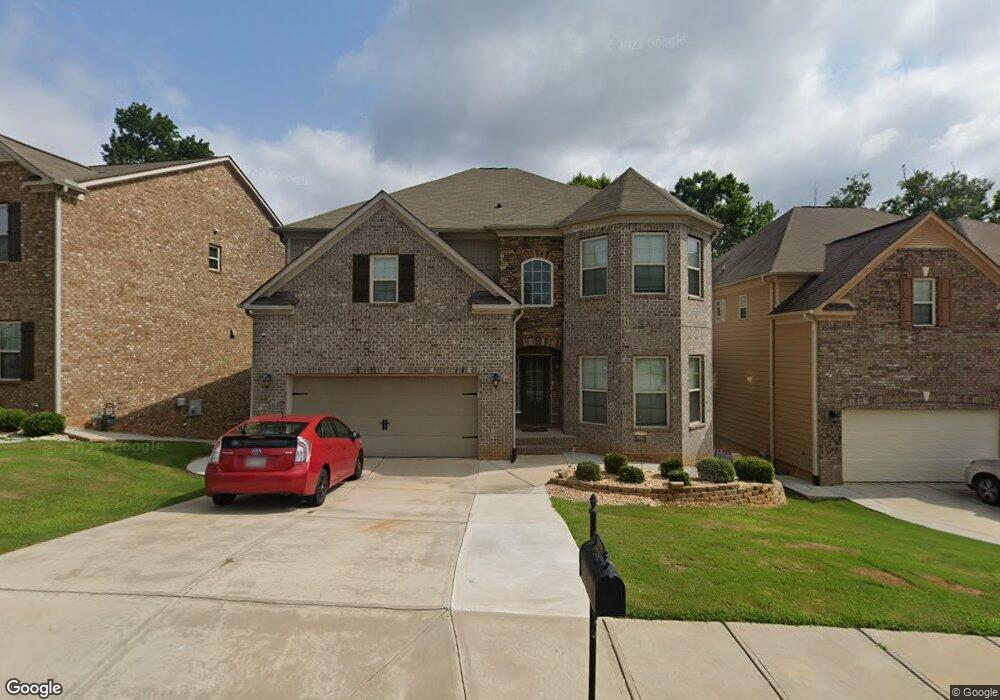
5800 Stow Dr Tucker, GA 30084
Estimated Value: $617,000 - $696,579
5
Beds
4
Baths
3,823
Sq Ft
$172/Sq Ft
Est. Value
About This Home
This home is located at 5800 Stow Dr, Tucker, GA 30084 and is currently estimated at $658,145, approximately $172 per square foot. 5800 Stow Dr is a home located in Gwinnett County with nearby schools including Arcado Elementary School, Trickum Middle School, and Parkview High School.
Ownership History
Date
Name
Owned For
Owner Type
Purchase Details
Closed on
Apr 27, 2018
Sold by
Mehmood Makani Imran
Bought by
Machhiwala Shehnaz Safdar
Current Estimated Value
Purchase Details
Closed on
Nov 27, 2013
Sold by
The Ryland Grp Inc
Bought by
Makani Imran and Machhiwala Shehnaz
Home Financials for this Owner
Home Financials are based on the most recent Mortgage that was taken out on this home.
Original Mortgage
$309,574
Interest Rate
4.25%
Mortgage Type
FHA
Purchase Details
Closed on
Oct 15, 2012
Sold by
Piedmont Investments 2 Llc
Bought by
The Ryland Grp Inc
Create a Home Valuation Report for This Property
The Home Valuation Report is an in-depth analysis detailing your home's value as well as a comparison with similar homes in the area
Home Values in the Area
Average Home Value in this Area
Purchase History
| Date | Buyer | Sale Price | Title Company |
|---|---|---|---|
| Machhiwala Shehnaz Safdar | -- | -- | |
| Makani Imran | $315,285 | -- | |
| The Ryland Grp Inc | $190,800 | -- |
Source: Public Records
Mortgage History
| Date | Status | Borrower | Loan Amount |
|---|---|---|---|
| Previous Owner | Makani Imran | $309,574 |
Source: Public Records
Tax History Compared to Growth
Tax History
| Year | Tax Paid | Tax Assessment Tax Assessment Total Assessment is a certain percentage of the fair market value that is determined by local assessors to be the total taxable value of land and additions on the property. | Land | Improvement |
|---|---|---|---|---|
| 2025 | $10,910 | $300,280 | $36,000 | $264,280 |
| 2024 | $11,026 | $300,520 | $36,000 | $264,520 |
| 2023 | $11,026 | $243,400 | $36,000 | $207,400 |
| 2022 | $8,947 | $243,400 | $36,000 | $207,400 |
| 2021 | $7,118 | $188,520 | $26,800 | $161,720 |
| 2020 | $7,162 | $188,520 | $26,800 | $161,720 |
| 2019 | $6,895 | $188,520 | $26,800 | $161,720 |
| 2018 | $5,389 | $166,960 | $22,400 | $144,560 |
| 2016 | $5,156 | $155,840 | $18,400 | $137,440 |
| 2015 | $4,583 | $126,080 | $18,400 | $107,680 |
| 2014 | -- | $126,080 | $18,400 | $107,680 |
Source: Public Records
Map
Nearby Homes