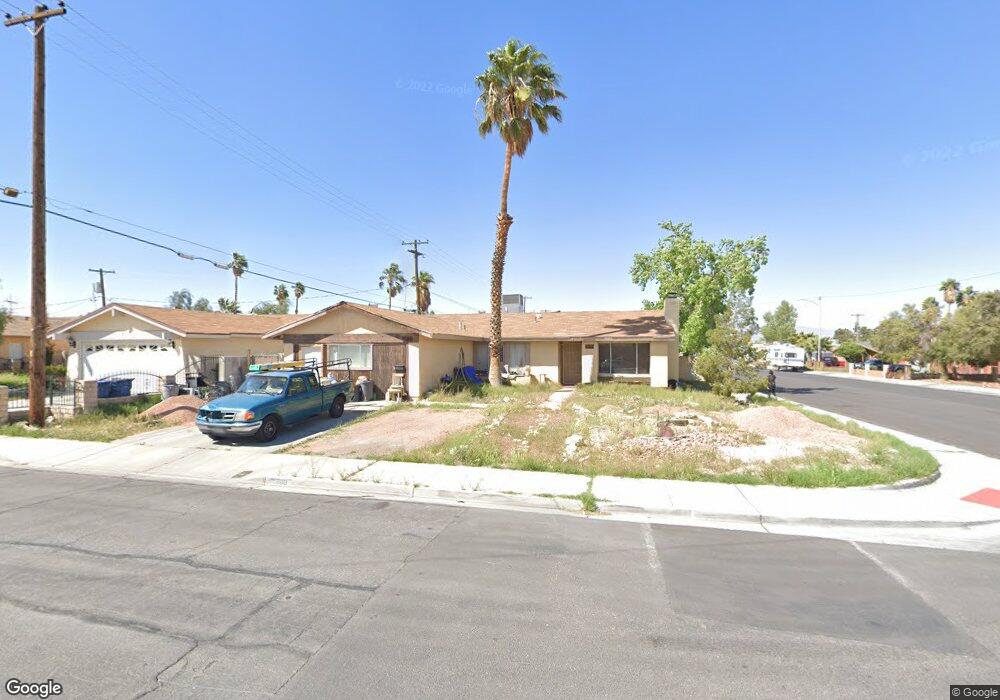
5800 Velma Ave Las Vegas, NV 89108
Michael Way NeighborhoodEstimated Value: $359,000 - $435,000
4
Beds
2
Baths
1,671
Sq Ft
$236/Sq Ft
Est. Value
About This Home
This home is located at 5800 Velma Ave, Las Vegas, NV 89108 and is currently estimated at $393,891, approximately $235 per square foot. 5800 Velma Ave is a home located in Clark County with nearby schools including Paul E. Culley Elementary School, J. Harold Brinley Middle School, and Western High School.
Ownership History
Date
Name
Owned For
Owner Type
Purchase Details
Closed on
Jan 31, 1997
Sold by
Scott Byron L and Scott Amy A
Bought by
Scott Byron L and Scott Amy A
Current Estimated Value
Home Financials for this Owner
Home Financials are based on the most recent Mortgage that was taken out on this home.
Original Mortgage
$96,759
Outstanding Balance
$11,117
Interest Rate
7.74%
Mortgage Type
FHA
Estimated Equity
$382,774
Purchase Details
Closed on
Apr 24, 1995
Sold by
Hud
Bought by
Scott Byron L and Scott Amy A
Home Financials for this Owner
Home Financials are based on the most recent Mortgage that was taken out on this home.
Original Mortgage
$99,182
Interest Rate
8.44%
Mortgage Type
FHA
Purchase Details
Closed on
Dec 22, 1994
Sold by
Midland Mtg Co
Bought by
Hud
Purchase Details
Closed on
Nov 29, 1994
Sold by
Stuhff Mark F and Stuhff Theresa A
Bought by
Midland Mtg Co
Create a Home Valuation Report for This Property
The Home Valuation Report is an in-depth analysis detailing your home's value as well as a comparison with similar homes in the area
Home Values in the Area
Average Home Value in this Area
Purchase History
| Date | Buyer | Sale Price | Title Company |
|---|---|---|---|
| Scott Byron L | -- | United Title | |
| Scott Byron L | -- | Land Title | |
| Hud | -- | United Title | |
| Midland Mtg Co | $94,751 | United Title |
Source: Public Records
Mortgage History
| Date | Status | Borrower | Loan Amount |
|---|---|---|---|
| Open | Scott Byron L | $96,759 | |
| Closed | Scott Byron L | $99,182 |
Source: Public Records
Tax History Compared to Growth
Tax History
| Year | Tax Paid | Tax Assessment Tax Assessment Total Assessment is a certain percentage of the fair market value that is determined by local assessors to be the total taxable value of land and additions on the property. | Land | Improvement |
|---|---|---|---|---|
| 2025 | $1,016 | $51,708 | $30,450 | $21,258 |
| 2024 | $987 | $51,708 | $30,450 | $21,258 |
| 2023 | $987 | $52,878 | $33,600 | $19,278 |
| 2022 | $958 | $43,124 | $25,900 | $17,224 |
| 2021 | $930 | $40,479 | $24,500 | $15,979 |
| 2020 | $900 | $36,869 | $21,350 | $15,519 |
| 2019 | $874 | $32,827 | $17,850 | $14,977 |
| 2018 | $849 | $31,344 | $16,450 | $14,894 |
| 2017 | $982 | $29,944 | $14,350 | $15,594 |
| 2016 | $805 | $28,578 | $11,900 | $16,678 |
| 2015 | $718 | $25,704 | $8,750 | $16,954 |
| 2014 | $696 | $24,101 | $6,650 | $17,451 |
Source: Public Records
Map
Nearby Homes
- 5712 Pinecone Place
- 5820 Gordon Ave
- 1700 Blue Mountain Dr
- 1710 Shadow Mountain Place
- 1864 Shadow Mountain Place
- 5329 Gaborone Ave
- 6008 Pebble Beach Blvd
- 3816 Vegas Dr
- 1452 N Jones Blvd
- 1401 N Michael Way Unit 118
- 1401 N Michael Way Unit 157
- 1336 N Jones Blvd
- 6224 Mandarin Dr
- 1120 Saylor Way
- 5128 Forrest Hills Ln
- 1744 Leonard Ln
- 6217 Yerba Ln
- 2021 San Simeon St
- 2132 Jeanne Dr
- 5104 Pebble Beach Blvd