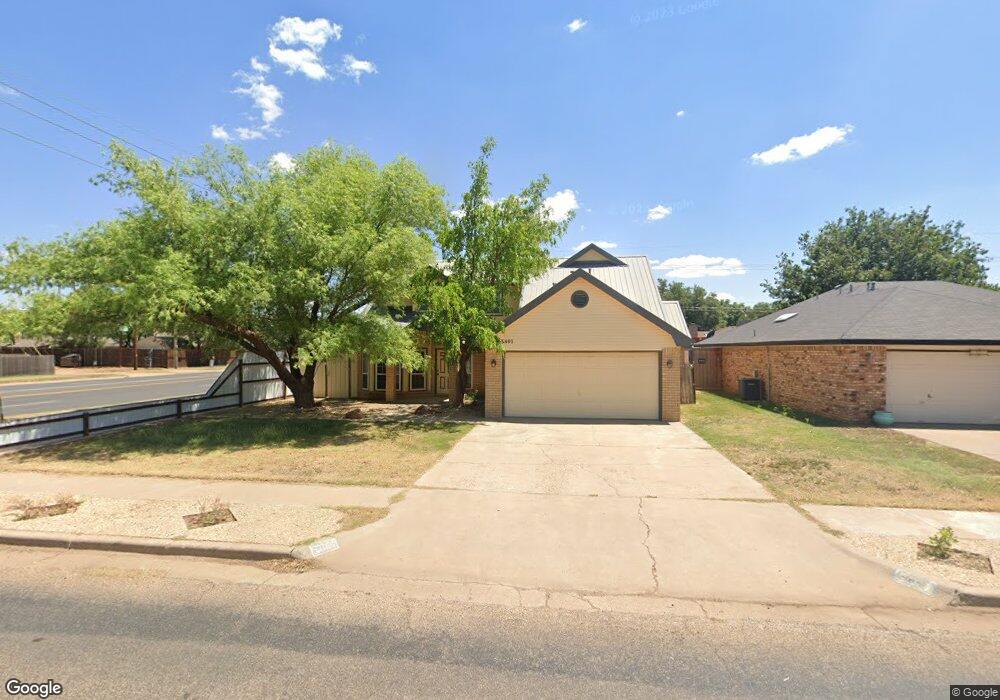
5801 73rd St Lubbock, TX 79424
South West Lubbock NeighborhoodEstimated Value: $234,980 - $257,000
4
Beds
2
Baths
2,136
Sq Ft
$115/Sq Ft
Est. Value
About This Home
This home is located at 5801 73rd St, Lubbock, TX 79424 and is currently estimated at $246,495, approximately $115 per square foot. 5801 73rd St is a home located in Lubbock County with nearby schools including Crestview Elementary School, Heritage Middle School, and Frenship High School.
Ownership History
Date
Name
Owned For
Owner Type
Purchase Details
Closed on
Nov 6, 2018
Sold by
Pekowski Edward and Pekowski Adele
Bought by
Pekowski John and Pekowski Yali
Current Estimated Value
Purchase Details
Closed on
Apr 28, 2017
Sold by
Shaffer Michael A and Shaffer Michelle L
Bought by
Chung Ya Li and Pekowski John M
Home Financials for this Owner
Home Financials are based on the most recent Mortgage that was taken out on this home.
Original Mortgage
$140,000
Outstanding Balance
$116,787
Interest Rate
4.3%
Mortgage Type
New Conventional
Estimated Equity
$129,708
Purchase Details
Closed on
Dec 4, 2009
Sold by
Nguyen Hung Minh and Nguyen Tuyet Do
Bought by
Shaffer Michael A and Shaffer Michelle L
Home Financials for this Owner
Home Financials are based on the most recent Mortgage that was taken out on this home.
Original Mortgage
$21,600
Interest Rate
5.01%
Mortgage Type
Unknown
Purchase Details
Closed on
Oct 15, 1991
Sold by
Rothwell Gary Inc
Bought by
Chung Ya Li and Pekowski John M
Create a Home Valuation Report for This Property
The Home Valuation Report is an in-depth analysis detailing your home's value as well as a comparison with similar homes in the area
Home Values in the Area
Average Home Value in this Area
Purchase History
| Date | Buyer | Sale Price | Title Company |
|---|---|---|---|
| Pekowski John | -- | None Available | |
| Chung Ya Li | -- | None Available | |
| Shaffer Michael A | -- | Western Title Company | |
| Chung Ya Li | -- | -- |
Source: Public Records
Mortgage History
| Date | Status | Borrower | Loan Amount |
|---|---|---|---|
| Open | Chung Ya Li | $140,000 | |
| Previous Owner | Shaffer Michael A | $21,600 | |
| Previous Owner | Shaffer Michael A | $115,200 |
Source: Public Records
Tax History
| Year | Tax Paid | Tax Assessment Tax Assessment Total Assessment is a certain percentage of the fair market value that is determined by local assessors to be the total taxable value of land and additions on the property. | Land | Improvement |
|---|---|---|---|---|
| 2025 | $3,244 | $213,171 | $17,360 | $195,811 |
| 2024 | $44 | $213,171 | $17,360 | $195,811 |
| 2023 | $4,308 | $205,708 | $17,360 | $188,348 |
| 2022 | $4,258 | $187,007 | $17,360 | $169,647 |
| 2021 | $4,405 | $182,154 | $17,360 | $164,794 |
| 2020 | $4,680 | $192,649 | $17,360 | $175,289 |
| 2019 | $4,664 | $186,578 | $17,360 | $169,218 |
| 2018 | $4,606 | $184,022 | $17,360 | $166,662 |
| 2017 | $4,080 | $162,837 | $17,360 | $145,477 |
| 2016 | $3,709 | $148,034 | $17,360 | $130,674 |
| 2015 | $3,211 | $141,976 | $12,400 | $129,576 |
| 2014 | $3,211 | $137,087 | $12,400 | $124,687 |
Source: Public Records
Map
Nearby Homes
- 5726 75th St
- 5722 75th St
- 5912 74th St
- 5711 70th Place
- 5712 70th Place
- 7408 Huron Ave
- 5514 73rd St
- 0 Homestead Ave Unit 202410270
- 0 Homestead Ave Unit 202410271
- 0 Homestead Ave Unit 202410272
- 0 Homestead Ave
- 0 Homestead Ave Unit 202410273
- 6902 Homestead Ave
- 5604 70th St
- 5504 73rd St
- 6019 77th St
- 0 Hope Ave Unit 202410262
- 0 Hope Ave Unit 202410265
- 0 Hope Ave Unit 202410264
- 0 Hope Ave Unit 202410263
Your Personal Tour Guide
Ask me questions while you tour the home.