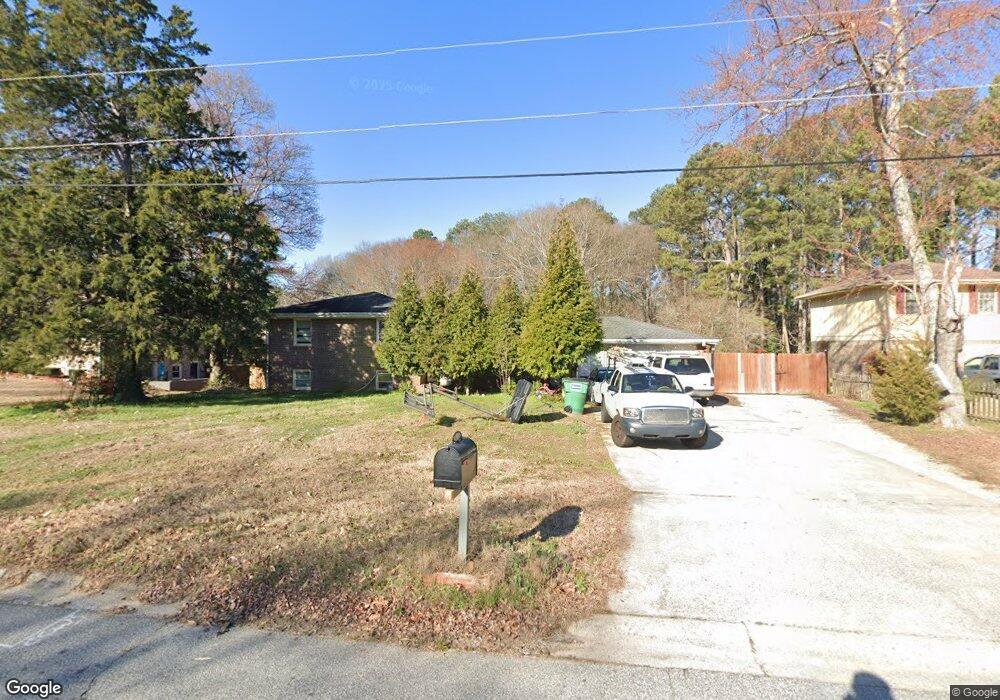
5801 Cedar Ln SW Mableton, GA 30126
Estimated Value: $286,682 - $328,000
3
Beds
2
Baths
1,641
Sq Ft
$185/Sq Ft
Est. Value
About This Home
This home is located at 5801 Cedar Ln SW, Mableton, GA 30126 and is currently estimated at $304,171, approximately $185 per square foot. 5801 Cedar Ln SW is a home located in Cobb County with nearby schools including Mableton Elementary School, Garrett Middle School, and Pebblebrook High School.
Ownership History
Date
Name
Owned For
Owner Type
Purchase Details
Closed on
Mar 10, 2010
Sold by
Federal Natl Mtg Assoc
Bought by
Arriaga Jose A and Calopino Sandra
Current Estimated Value
Purchase Details
Closed on
Dec 1, 2009
Sold by
Hsbc Mtg Corp Usa
Bought by
Federal Natl Mtg Assn Fnma
Purchase Details
Closed on
Mar 19, 2004
Sold by
Wachovia Bk Of Delaware Na
Bought by
Torres Faustino
Home Financials for this Owner
Home Financials are based on the most recent Mortgage that was taken out on this home.
Original Mortgage
$132,405
Interest Rate
5.53%
Mortgage Type
New Conventional
Purchase Details
Closed on
Nov 4, 2003
Sold by
Goodin Jonathan L and Goodin Catillion S
Bought by
Wachovia Bank Of Delaware Na
Purchase Details
Closed on
Mar 20, 1998
Sold by
Moody Eddie R and Moody Melissa C
Bought by
Goodin Jonathan L
Home Financials for this Owner
Home Financials are based on the most recent Mortgage that was taken out on this home.
Original Mortgage
$91,769
Interest Rate
7.14%
Mortgage Type
FHA
Create a Home Valuation Report for This Property
The Home Valuation Report is an in-depth analysis detailing your home's value as well as a comparison with similar homes in the area
Home Values in the Area
Average Home Value in this Area
Purchase History
| Date | Buyer | Sale Price | Title Company |
|---|---|---|---|
| Arriaga Jose A | -- | -- | |
| Federal Natl Mtg Assn Fnma | -- | -- | |
| Hsbc Mtg | $123,935 | -- | |
| Torres Faustino | $136,500 | -- | |
| Wachovia Bank Of Delaware Na | $123,460 | -- | |
| Goodin Jonathan L | $93,100 | -- |
Source: Public Records
Mortgage History
| Date | Status | Borrower | Loan Amount |
|---|---|---|---|
| Previous Owner | Torres Faustino | $132,405 | |
| Previous Owner | Goodin Jonathan L | $91,769 |
Source: Public Records
Tax History Compared to Growth
Tax History
| Year | Tax Paid | Tax Assessment Tax Assessment Total Assessment is a certain percentage of the fair market value that is determined by local assessors to be the total taxable value of land and additions on the property. | Land | Improvement |
|---|---|---|---|---|
| 2025 | $3,999 | $132,716 | $22,000 | $110,716 |
| 2024 | $4,001 | $132,716 | $22,000 | $110,716 |
| 2023 | $2,544 | $84,364 | $12,800 | $71,564 |
| 2022 | $2,560 | $84,364 | $12,800 | $71,564 |
| 2021 | $2,268 | $74,740 | $11,200 | $63,540 |
| 2020 | $1,695 | $55,864 | $11,200 | $44,664 |
| 2019 | $1,695 | $55,864 | $11,200 | $44,664 |
| 2018 | $1,438 | $47,396 | $10,000 | $37,396 |
| 2017 | $964 | $33,520 | $6,000 | $27,520 |
| 2016 | $964 | $33,520 | $6,000 | $27,520 |
| 2015 | $988 | $33,520 | $6,000 | $27,520 |
| 2014 | $976 | $32,844 | $0 | $0 |
Source: Public Records
Map
Nearby Homes
- 5800 Cedar Ln SW
- 1397 Jewell Ct SW
- 1031 Bettina Ct SW
- 1034 Bettina Ct SW
- 5832 Silver Lake Dr
- 1144 Angelia Dr SW
- 1426 Thunderwood Ln SW
- 5615 Hislop Ln Unit 82
- 1582 Pine Cir
- 6243 David Ln SW
- 1550 Greenbrook Dr
- 1076 Stoney Creek Ln
- 1618 Old Alabama Rd
- 1628 Pendley Dr
- 1065 Stoney Creek Ln Unit 2
- 6302 Mount Pisgah Ln
- 1310 Dillon Rd
- 5527 Andrew Dr SW
- 5957 Cedar Ln SW
- 5815 Cedar Ln SW
- 5790 Cedar Ln SW
- 5825 Cedar Ln SW
- 1330 Old Alabama Rd SW
- 1256 Old Alabama Rd SW
- 5938 Cedar Ln SW
- 1331 Old Alabama Rd SW
- 5830 Cedar Ln SW
- 1265 Dunn Pkwy SW
- 1246 Old Alabama Rd SW
- 1275 Dunn Pkwy SW
- 6011 Whitetail Deer Run
- 1255 Dunn Pkwy SW
- 0 Old Alabama Rd SW Unit 7244662
- 1417 Old Alabama Rd SW
- 0 Old Alabama Rd SW Unit 8434964
- 0 Old Alabama Rd SW Unit 8075736
- 0 Old Alabama Rd SW Unit 7594406
- 0 Old Alabama Rd SW Unit 7328680