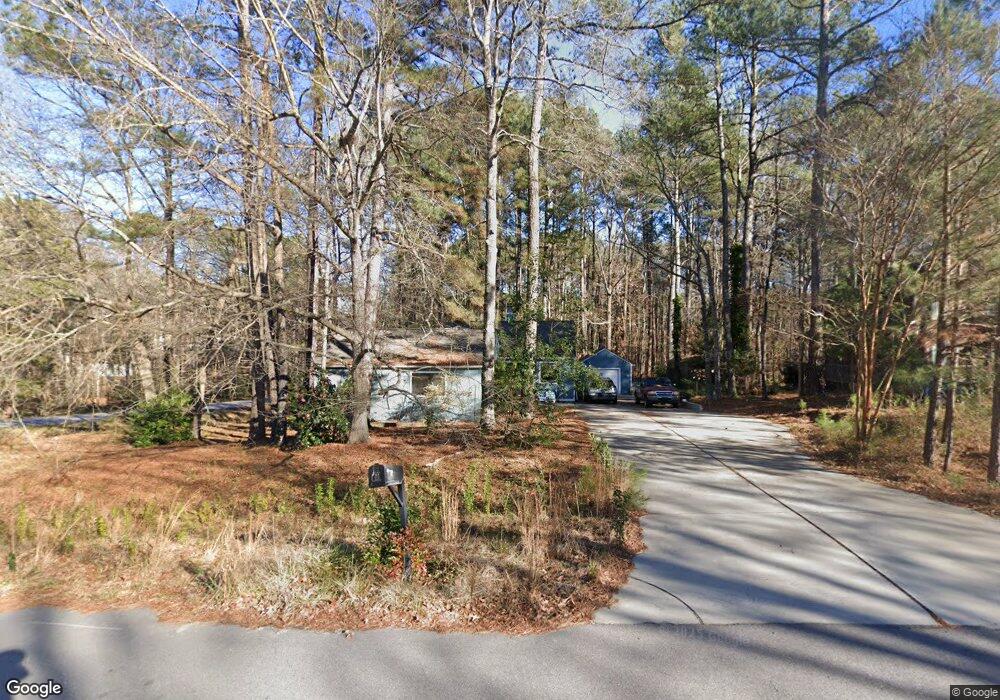
5801 Shannas Way Durham, NC 27713
Woodcroft NeighborhoodEstimated Value: $385,105 - $413,000
3
Beds
2
Baths
1,510
Sq Ft
$264/Sq Ft
Est. Value
About This Home
This home is located at 5801 Shannas Way, Durham, NC 27713 and is currently estimated at $398,276, approximately $263 per square foot. 5801 Shannas Way is a home located in Durham County with nearby schools including Pearsontown Elementary School, Lowe's Grove Middle, and Hillside High School.
Ownership History
Date
Name
Owned For
Owner Type
Purchase Details
Closed on
Apr 25, 2018
Sold by
Saleska Chad R and Saleska Erica L
Bought by
Yentes Ruchard D
Current Estimated Value
Home Financials for this Owner
Home Financials are based on the most recent Mortgage that was taken out on this home.
Original Mortgage
$218,975
Outstanding Balance
$188,315
Interest Rate
4.44%
Mortgage Type
New Conventional
Estimated Equity
$209,961
Purchase Details
Closed on
Aug 26, 2006
Sold by
Johnson Ahren K and Johnson Alexandra P
Bought by
Saleska Chad R and Saleska Erica L
Home Financials for this Owner
Home Financials are based on the most recent Mortgage that was taken out on this home.
Original Mortgage
$142,800
Interest Rate
6.73%
Mortgage Type
Purchase Money Mortgage
Purchase Details
Closed on
Jun 10, 2001
Sold by
Presnell Michael L and Presnell Sharon C
Bought by
Johnson Ahren K and Johnson Alexandra P
Home Financials for this Owner
Home Financials are based on the most recent Mortgage that was taken out on this home.
Original Mortgage
$126,000
Interest Rate
7.06%
Create a Home Valuation Report for This Property
The Home Valuation Report is an in-depth analysis detailing your home's value as well as a comparison with similar homes in the area
Home Values in the Area
Average Home Value in this Area
Purchase History
| Date | Buyer | Sale Price | Title Company |
|---|---|---|---|
| Yentes Ruchard D | $230,500 | None Available | |
| Saleska Chad R | $178,500 | Bb&T | |
| Johnson Ahren K | $144,000 | -- |
Source: Public Records
Mortgage History
| Date | Status | Borrower | Loan Amount |
|---|---|---|---|
| Open | Yentes Ruchard D | $218,975 | |
| Previous Owner | Saleska Chad R | $142,800 | |
| Previous Owner | Johnson Ahren K | $126,000 |
Source: Public Records
Tax History Compared to Growth
Tax History
| Year | Tax Paid | Tax Assessment Tax Assessment Total Assessment is a certain percentage of the fair market value that is determined by local assessors to be the total taxable value of land and additions on the property. | Land | Improvement |
|---|---|---|---|---|
| 2025 | $3,939 | $397,378 | $126,504 | $270,874 |
| 2024 | $3,067 | $219,883 | $61,110 | $158,773 |
| 2023 | $2,880 | $219,883 | $61,110 | $158,773 |
| 2022 | $2,814 | $219,883 | $61,110 | $158,773 |
| 2021 | $2,801 | $219,883 | $61,110 | $158,773 |
| 2020 | $2,735 | $219,883 | $61,110 | $158,773 |
| 2019 | $2,735 | $219,883 | $61,110 | $158,773 |
| 2018 | $2,570 | $189,464 | $50,400 | $139,064 |
| 2017 | $2,551 | $189,464 | $50,400 | $139,064 |
| 2016 | $2,465 | $189,464 | $50,400 | $139,064 |
| 2015 | $2,570 | $185,639 | $33,050 | $152,589 |
| 2014 | $2,570 | $185,639 | $33,050 | $152,589 |
Source: Public Records
Map
Nearby Homes
- 5816 Henner Place
- 1207 Wedgewood Ln
- 8 Nutmeg Ct
- 19 Meadhall Ct
- 1303 Crimson Creek Dr
- 9 Drakesway Ct
- 5808 Sandstone Dr
- 1304 Copper Creek Dr
- 5310 Reams Run Rd
- 3119 N Carolina 55
- 5205 Kemmont Dr
- 1 Chownings St
- 6304 Forest Ridge Dr
- 5708 Catskill Ct
- 3617 Sugar Tree Place
- 1001 Pebble Creek Crossing Unit 12
- 1129 Pebble Creek Crossing
- 5624 Barbee Rd
- 4348 S Alston Ave
- 1211 Odyssey Dr
- 5807 Shannas Way
- 1105 Wedgewood Ln
- 5811 Shannas Way
- 5802 Shannas Way
- 5802 Henner Place
- 1117 Wedgewood Ln
- 5806 Henner Place
- 5808 Shannas Way
- 1021 Wedgewood Ln
- 1016 Wedgewood Ln
- 5810 Henner Place
- 5812 Shannas Way
- 1125 Wedgewood Ln
- 1017 Wedgewood Ln
- 5815 Shannas Way
- 5814 Henner Place
- 1012 Wedgewood Ln
- 5814 Shannas Way
- 1011 Wedgewood Ln
- 5816 Shannas Way