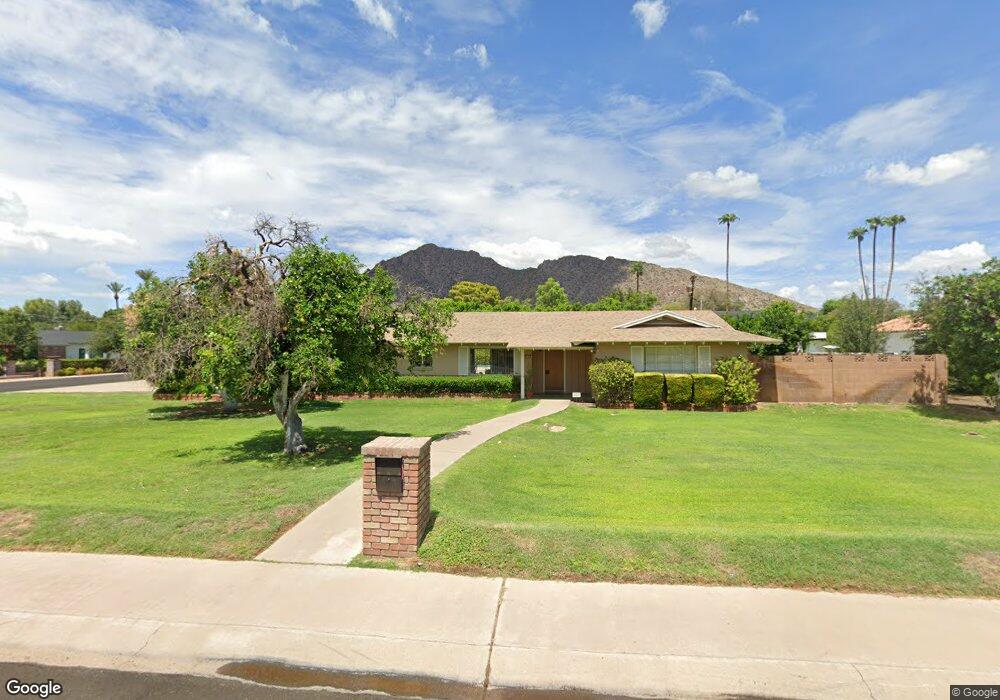
5802 E Calle Del Norte Phoenix, AZ 85018
Camelback East Village NeighborhoodEstimated Value: $2,182,000 - $2,493,000
Studio
3
Baths
2,320
Sq Ft
$995/Sq Ft
Est. Value
About This Home
This home is located at 5802 E Calle Del Norte, Phoenix, AZ 85018 and is currently estimated at $2,308,527, approximately $995 per square foot. 5802 E Calle Del Norte is a home located in Maricopa County with nearby schools including Hopi Elementary School, Ingleside Middle School, and Arcadia High School.
Ownership History
Date
Name
Owned For
Owner Type
Purchase Details
Closed on
Aug 30, 2024
Sold by
Jan Warne Cacheris and Jan Christopher John
Bought by
5802 Sch C Llc
Current Estimated Value
Purchase Details
Closed on
Jul 9, 2024
Sold by
Cacheris Elaine M
Bought by
Jan Warne Cacheris And Christopher John Cache and Cacheris
Purchase Details
Closed on
Jun 6, 2024
Sold by
Helen J Cacheris Revocable Living Trust and Cacheris Christopher J
Bought by
Cacheris Christopher J and Cacheris Elaine M
Purchase Details
Closed on
May 24, 2024
Sold by
Helen J Cacheris Revocable Living Trust and Cacheris Christopher J
Bought by
Cacheris Christopher J and Cacheris Elaine M
Purchase Details
Closed on
Mar 30, 2020
Sold by
Cacheris Helen Jaffurs and John Christ Cacheris & Helen J
Bought by
Cacheris Helen J and Cacheris Helen J
Purchase Details
Closed on
Aug 10, 2005
Sold by
Cacheris Helen Jaffurs
Bought by
Cacheris Helen Jaffurs and John Christ & Helen Jaffurs Cacheris Rev
Purchase Details
Closed on
Jul 12, 1994
Sold by
Cacheris John C and Cacheris Helen J
Bought by
Cacheris John Christ and Cacheris Helen Jaffurs
Create a Home Valuation Report for This Property
The Home Valuation Report is an in-depth analysis detailing your home's value as well as a comparison with similar homes in the area
Home Values in the Area
Average Home Value in this Area
Purchase History
| Date | Buyer | Sale Price | Title Company |
|---|---|---|---|
| 5802 Sch C Llc | -- | None Listed On Document | |
| 5802 Sch B Llc | -- | None Listed On Document | |
| Jan Warne Cacheris And Christopher John Cache | -- | None Listed On Document | |
| Cacheris Christopher J | -- | None Listed On Document | |
| Cacheris Christopher J | -- | None Listed On Document | |
| Cacheris Helen J | -- | None Available | |
| Cacheris Helen Jaffurs | -- | -- | |
| Cacheris John Christ | -- | -- |
Source: Public Records
Tax History
| Year | Tax Paid | Tax Assessment Tax Assessment Total Assessment is a certain percentage of the fair market value that is determined by local assessors to be the total taxable value of land and additions on the property. | Land | Improvement |
|---|---|---|---|---|
| 2025 | $7,323 | $88,989 | -- | -- |
| 2024 | $6,254 | $84,752 | -- | -- |
| 2023 | $6,254 | $121,110 | $24,220 | $96,890 |
| 2022 | $5,973 | $93,250 | $18,650 | $74,600 |
| 2021 | $6,213 | $89,130 | $17,820 | $71,310 |
| 2020 | $6,112 | $80,000 | $16,000 | $64,000 |
| 2019 | $5,861 | $79,260 | $15,850 | $63,410 |
| 2018 | $5,613 | $72,860 | $14,570 | $58,290 |
| 2017 | $5,369 | $74,720 | $14,940 | $59,780 |
| 2016 | $5,216 | $66,550 | $13,310 | $53,240 |
| 2015 | $4,731 | $63,480 | $12,690 | $50,790 |
Source: Public Records
Map
Nearby Homes
- 5816 E Calle Del Media
- 5715 E Monterosa St
- 5944 E Calle Del Norte
- 4220 N 57th Place
- 5714 E Lafayette Blvd
- 5903 E Lafayette Blvd
- 5627 E Monterosa St
- 4413 N Camino Allenada
- 5633 E Lafayette Blvd
- 5617 E Montecito Ave
- 4350 N Jokake Dr
- 4425 N Arcadia Ln
- 4442 N 59th Place
- 6114 E Calle Del Norte
- 3675 N 59th Place
- 4030 N 54th Place
- 5446 E Exeter Blvd
- 4227 N 62nd St
- 5501 E Camelback Rd
- 4575 N Phoenician Blvd Unit 2
- 5816 E Calle Del Norte
- 5801 E Exeter Blvd Unit 1
- 5801 E Exeter Blvd
- 4234 N 58th St
- 5801 E Calle Del Norte
- 5815 E Exeter Blvd
- 4220 N 58th St Unit 27
- 4220 N 58th St
- 5815 E Calle Del Norte Unit 6
- 5815 E Calle Del Norte
- 5815 E Calle Del Norte
- 5743 E Exeter Blvd
- 5828 E Calle Del Norte
- 4231 N 57th Way
- 5837 E Exeter Blvd
- 5829 E Calle Del Norte
- 4217 N 57th Way
- 4202 N 58th St
- 5802 E Calle Del Media
- 5727 E Exeter Blvd
Your Personal Tour Guide
Ask me questions while you tour the home.