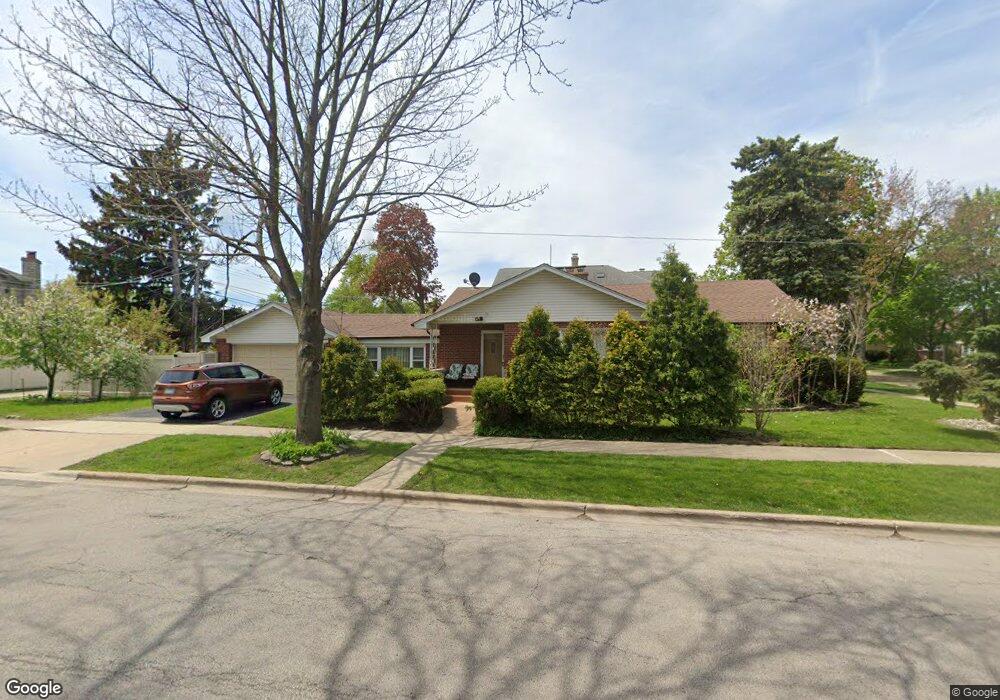
5803 Capulina Ave Morton Grove, IL 60053
Estimated Value: $443,652 - $490,000
6
Beds
2
Baths
1,309
Sq Ft
$356/Sq Ft
Est. Value
About This Home
This home is located at 5803 Capulina Ave, Morton Grove, IL 60053 and is currently estimated at $466,413, approximately $356 per square foot. 5803 Capulina Ave is a home located in Cook County with nearby schools including Park View Elementary School, Niles West High School, and Arie Crown Hebrew Day School.
Ownership History
Date
Name
Owned For
Owner Type
Purchase Details
Closed on
Jun 16, 2008
Sold by
Bank Of New York
Bought by
Munshi Gulammohmed
Current Estimated Value
Purchase Details
Closed on
Mar 13, 2008
Sold by
Siddique Farhan
Bought by
Bank Of New York and Scwabs Inc Asset Backed Certificates Ser
Purchase Details
Closed on
May 1, 2001
Sold by
Siddique Fahran and Siddique Ellen Mae
Bought by
Siddique Fahran and Siddique Ellen Mae
Home Financials for this Owner
Home Financials are based on the most recent Mortgage that was taken out on this home.
Original Mortgage
$190,000
Interest Rate
7.02%
Purchase Details
Closed on
Nov 10, 1995
Sold by
Yap Lowell T and Yap Salome M
Bought by
Siddique Farhan and Siddique Ellen Mae
Home Financials for this Owner
Home Financials are based on the most recent Mortgage that was taken out on this home.
Original Mortgage
$179,000
Interest Rate
7.7%
Create a Home Valuation Report for This Property
The Home Valuation Report is an in-depth analysis detailing your home's value as well as a comparison with similar homes in the area
Home Values in the Area
Average Home Value in this Area
Purchase History
| Date | Buyer | Sale Price | Title Company |
|---|---|---|---|
| Munshi Gulammohmed | $327,500 | First American Title | |
| Bank Of New York | -- | None Available | |
| Siddique Fahran | -- | First American Title | |
| Siddique Farhan | $298,500 | 1St American Title |
Source: Public Records
Mortgage History
| Date | Status | Borrower | Loan Amount |
|---|---|---|---|
| Previous Owner | Siddique Fahran | $190,000 | |
| Previous Owner | Siddique Farhan | $179,000 |
Source: Public Records
Tax History Compared to Growth
Tax History
| Year | Tax Paid | Tax Assessment Tax Assessment Total Assessment is a certain percentage of the fair market value that is determined by local assessors to be the total taxable value of land and additions on the property. | Land | Improvement |
|---|---|---|---|---|
| 2024 | $3,589 | $39,000 | $9,672 | $29,328 |
| 2023 | $3,528 | $39,000 | $9,672 | $29,328 |
| 2022 | $3,528 | $39,000 | $9,672 | $29,328 |
| 2021 | $4,003 | $27,163 | $5,952 | $21,211 |
| 2020 | $3,630 | $27,163 | $5,952 | $21,211 |
| 2019 | $3,599 | $30,521 | $5,952 | $24,569 |
| 2018 | $4,063 | $26,273 | $5,394 | $20,879 |
| 2017 | $4,021 | $26,273 | $5,394 | $20,879 |
| 2016 | $4,648 | $26,273 | $5,394 | $20,879 |
| 2015 | $5,250 | $20,790 | $4,650 | $16,140 |
| 2014 | $6,657 | $25,678 | $4,650 | $21,028 |
| 2013 | $6,659 | $25,678 | $4,650 | $21,028 |
Source: Public Records
Map
Nearby Homes
- 8708 Central Ave
- 8836 Mansfield Ave
- 8841 Menard Ave
- 6035 Lincoln Ave
- 5510 Lincoln Ave Unit B301
- 5510 Lincoln Ave Unit B101
- 5506 Lincoln Ave Unit A117
- 5506 Lincoln Ave Unit A216
- 8849 Mcvicker Ave
- 8918 Parkside Ave
- 8541 Lotus Ave Unit 914
- 5501 Lincoln Ave Unit 203
- 5500 Lincoln Ave Unit 407W
- 5500 Lincoln Ave Unit 116E
- 5500 Lincoln Ave Unit 109W
- 8655 Harms Rd
- 6140 Elm St
- 5536 Greenwood St
- 6166 Mayfair St Unit 33714
- 5459 Suffield Ct
- 5805 Capulina Ave
- 5809 Capulina Ave
- 5817 Capulina Ave
- 5800 S Park Ave
- 5800 S Park Ave
- 5806 S Park Ave
- 5806 S Park Ave
- 5819 Capulina Ave
- 5810 S Park Ave
- 5810 S Park Ave
- 5800 Capulina Ave
- 5804 Capulina Ave
- 5821 Capulina Ave
- 5806 Capulina Ave
- 5812 Capulina Ave
- 5812 Capulina Ave
- 5814 S Park Ave
- 5823 Capulina Ave
- 5818 S Park Ave
- 5825 Capulina Ave