Estimated Value: $569,000 - $771,000
--
Bed
5
Baths
3,014
Sq Ft
$217/Sq Ft
Est. Value
About This Home
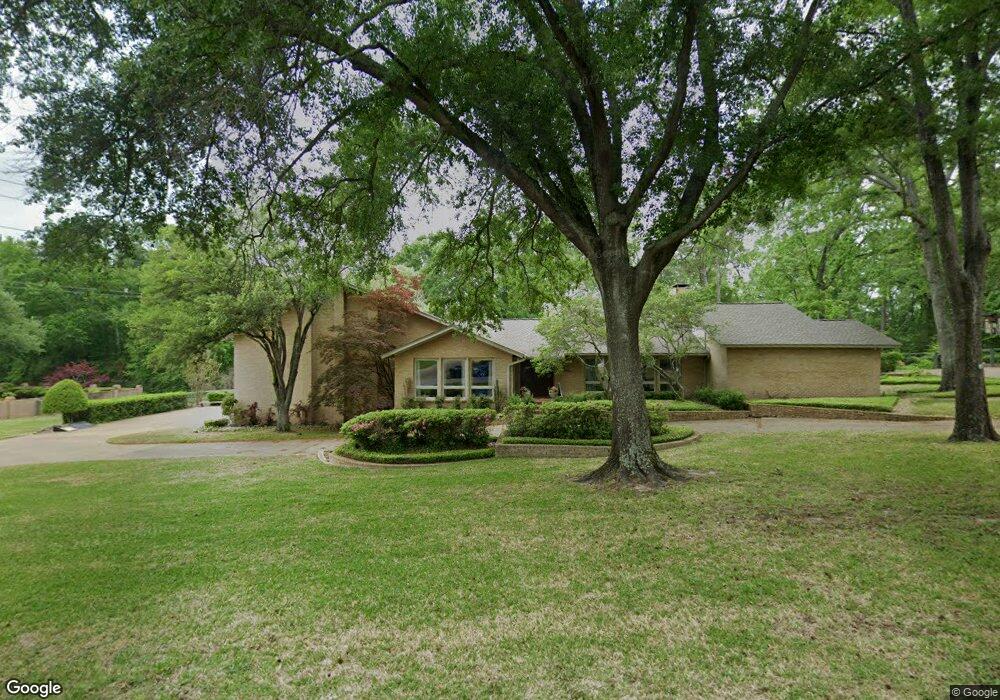
This home is located at 5803 Covey Ln, Tyler, TX 75703 and is currently estimated at $654,058, approximately $217 per square foot. 5803 Covey Ln is a home located in Smith County with nearby schools including Rice Elementary School, Hubbard Middle School, and Tyler Legacy High School.
Create a Home Valuation Report for This Property
The Home Valuation Report is an in-depth analysis detailing your home's value as well as a comparison with similar homes in the area
Home Values in the Area
Average Home Value in this Area
Tax History Compared to Growth
Tax History
| Year | Tax Paid | Tax Assessment Tax Assessment Total Assessment is a certain percentage of the fair market value that is determined by local assessors to be the total taxable value of land and additions on the property. | Land | Improvement |
|---|---|---|---|---|
| 2025 | $7,872 | $547,032 | $75,463 | $471,569 |
| 2024 | $7,872 | $523,933 | $75,463 | $471,569 |
| 2023 | $8,303 | $507,261 | $35,692 | $471,569 |
| 2022 | $8,483 | $466,255 | $35,692 | $430,563 |
| 2021 | $8,259 | $393,639 | $35,692 | $357,947 |
| 2020 | $8,423 | $393,639 | $35,692 | $357,947 |
| 2019 | $547 | $378,269 | $35,692 | $342,577 |
| 2018 | $8,227 | $378,269 | $35,692 | $342,577 |
| 2017 | $8,076 | $378,269 | $35,692 | $342,577 |
| 2016 | $7,821 | $366,318 | $35,692 | $330,626 |
| 2015 | $6,604 | $359,750 | $35,692 | $324,058 |
| 2014 | $6,604 | $352,418 | $35,692 | $316,726 |
Source: Public Records
Map
Nearby Homes
- 5789 New Copeland Rd
- 5406 Carmel Ct
- 5783 New Copeland Rd
- 6109 Quail Creek Dr
- 6102 Wilderness Rd
- 5709 Fern Cove Terrace
- 14237 County Road 192
- 14195 County Road 192
- 14245 County Road 192
- 5219 Stagecoach St
- 5721 Fern Cove Terrace
- 759 Hampton Hill Dr
- 1137 Gardenwood Dr
- 1133 Gardenwood Dr
- 1103 Laurelwood Dr
- 5117 Stagecoach St
- 5117 Stagecoach Dr
- 619 Wellington St
- 505 Bentley Ct
- 1021 Kingspark Dr
- 5803 5803 Covey Ln
- 5801 Covey Ln
- 5801 5801 Covey
- 5811 Covey Ln
- 615 W Rieck Rd
- 5801 Quail Creek Dr
- 5812 5812 Covey Ln
- 5812 Covey Ln
- 505 W Rieck Rd
- 505 W Rieck Rd
- 5716 Quail Creek Dr
- 5817 Quail Creek Dr
- 5623 Quail Creek Dr
- 5716 5716 Quail Creek Dr
- 5716 5716 Quail Creek
- 5626 5626 Quail Creek Dr
- 5802 Wilderness Rd
- 5626 Quail Creek Dr
- 5815 Covey Ln
- 5806 5806 Wilderness