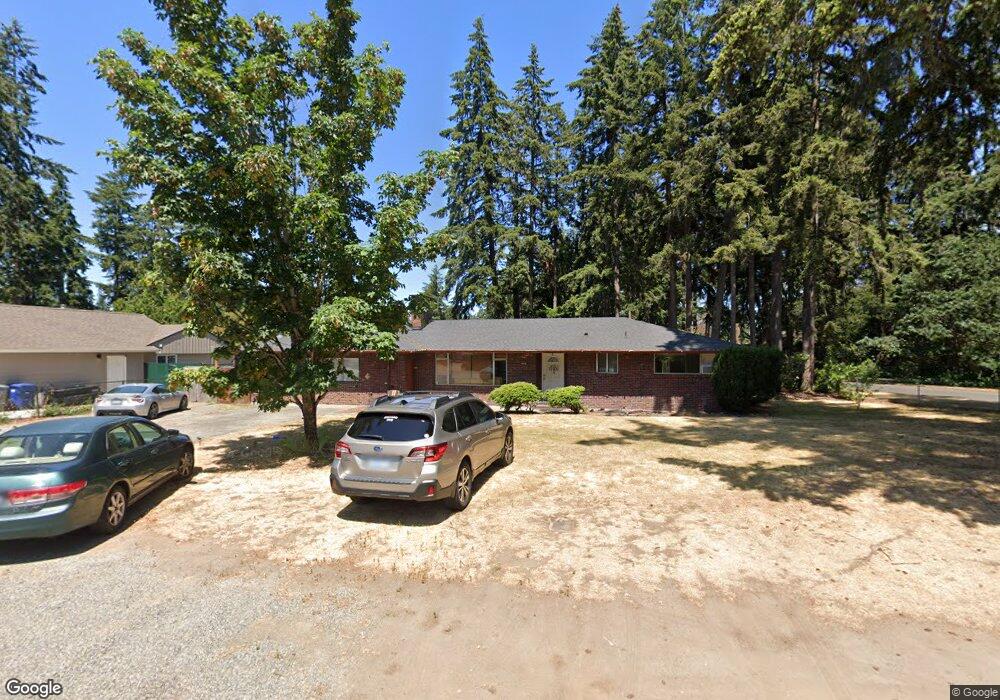
5805 122nd St SW Lakewood, WA 98499
South Lakes NeighborhoodEstimated Value: $604,000 - $663,000
7
Beds
3
Baths
3,066
Sq Ft
$204/Sq Ft
Est. Value
About This Home
This home is located at 5805 122nd St SW, Lakewood, WA 98499 and is currently estimated at $624,659, approximately $203 per square foot. 5805 122nd St SW is a home located in Pierce County with nearby schools including Tyee Park Elementary School, Lochburn Middle School, and Clover Park High School.
Ownership History
Date
Name
Owned For
Owner Type
Purchase Details
Closed on
May 30, 2023
Sold by
Vatsa Ajay K
Bought by
Vatsa Ajay K and Vatsa Parveen
Current Estimated Value
Purchase Details
Closed on
Mar 2, 2023
Sold by
Revocable Living Trust
Bought by
Vatsa Ajay K
Purchase Details
Closed on
Nov 22, 2017
Sold by
Vatsa Subhash
Bought by
Vatsa Subhash and Living Trust Of Subhash Vatsa
Purchase Details
Closed on
Oct 24, 2002
Sold by
Emmett Robert N
Bought by
Vatsa Subhase and Vats Sita
Home Financials for this Owner
Home Financials are based on the most recent Mortgage that was taken out on this home.
Original Mortgage
$117,000
Interest Rate
6.09%
Purchase Details
Closed on
Dec 11, 1996
Sold by
Taylor Jesse R and Taylor Barbara A
Bought by
Emment Robert N and Emmett Ina M
Home Financials for this Owner
Home Financials are based on the most recent Mortgage that was taken out on this home.
Original Mortgage
$99,591
Interest Rate
7.76%
Mortgage Type
FHA
Create a Home Valuation Report for This Property
The Home Valuation Report is an in-depth analysis detailing your home's value as well as a comparison with similar homes in the area
Home Values in the Area
Average Home Value in this Area
Purchase History
| Date | Buyer | Sale Price | Title Company |
|---|---|---|---|
| Vatsa Ajay K | -- | None Listed On Document | |
| Vatsa Ajay K | -- | -- | |
| Vatsa Subhash | -- | None Available | |
| Vatsa Subhase | $156,450 | Transnation Title Insurance | |
| Emment Robert N | $102,000 | -- |
Source: Public Records
Mortgage History
| Date | Status | Borrower | Loan Amount |
|---|---|---|---|
| Previous Owner | Vatsa Subhase | $117,000 | |
| Previous Owner | Emment Robert N | $99,591 |
Source: Public Records
Tax History Compared to Growth
Tax History
| Year | Tax Paid | Tax Assessment Tax Assessment Total Assessment is a certain percentage of the fair market value that is determined by local assessors to be the total taxable value of land and additions on the property. | Land | Improvement |
|---|---|---|---|---|
| 2025 | $5,964 | $643,400 | $245,700 | $397,700 |
| 2024 | $5,964 | $586,600 | $230,800 | $355,800 |
| 2023 | $5,964 | $555,100 | $224,800 | $330,300 |
| 2022 | $5,621 | $578,800 | $234,400 | $344,400 |
| 2021 | $5,524 | $426,800 | $153,100 | $273,700 |
| 2019 | $3,954 | $396,100 | $133,900 | $262,200 |
| 2018 | $4,277 | $331,600 | $119,800 | $211,800 |
| 2017 | $3,978 | $290,400 | $87,900 | $202,500 |
| 2016 | $3,323 | $212,300 | $51,700 | $160,600 |
| 2014 | $2,962 | $209,400 | $51,700 | $157,700 |
| 2013 | $2,962 | $192,400 | $47,400 | $145,000 |
Source: Public Records
Map
Nearby Homes
- 53 Lindale Ln SW
- 6009 119th St SW
- 11721 Creekside Dr SW
- 12411 Glenwood Ave SW
- 12551 Springbrook Ln SW
- 6323 Hillcrest Dr SW
- 12316 Rebecca Dr SW
- 5501 116th St SW
- 12624 Glenwood Ave SW
- 11523 Clover Crest Dr SW
- 11411 Clover Crest Dr SW
- 11308 Loma Place SW
- 6638 Hilltop Ln SW
- 12621 Nyanza Rd SW
- 5503 112th St SW
- 11010 Davisson Rd SW
- 11623 Madera Gardens Dr SW
- 10915 Davisson Rd SW
- 11215 Madera Cir SW
- 11211 Madera Cir SW
- 5819 122nd St SW
- 12026 Clover Creek Dr SW
- 5901 122nd St SW
- 5810 122nd St SW
- 12117 Clover Creek Dr SW
- 5818 122nd St SW
- 12206 Clover Creek Dr SW
- 5902 122nd St SW
- 12018 Clover Creek Dr SW
- 5907 122nd St SW
- 5906 122nd St SW
- 52 Lindale Ln SW
- 5915 122nd St SW
- 12010 Clover Creek Dr SW
- 5823 Hillcrest Dr SW
- 12101 Clover Creek Dr SW
- 5811 Hillcrest Dr SW
- 12007 Clover Creek Dr SW
- 12111 Clover Creek Dr SW
- 5819 Hillcrest Dr SW