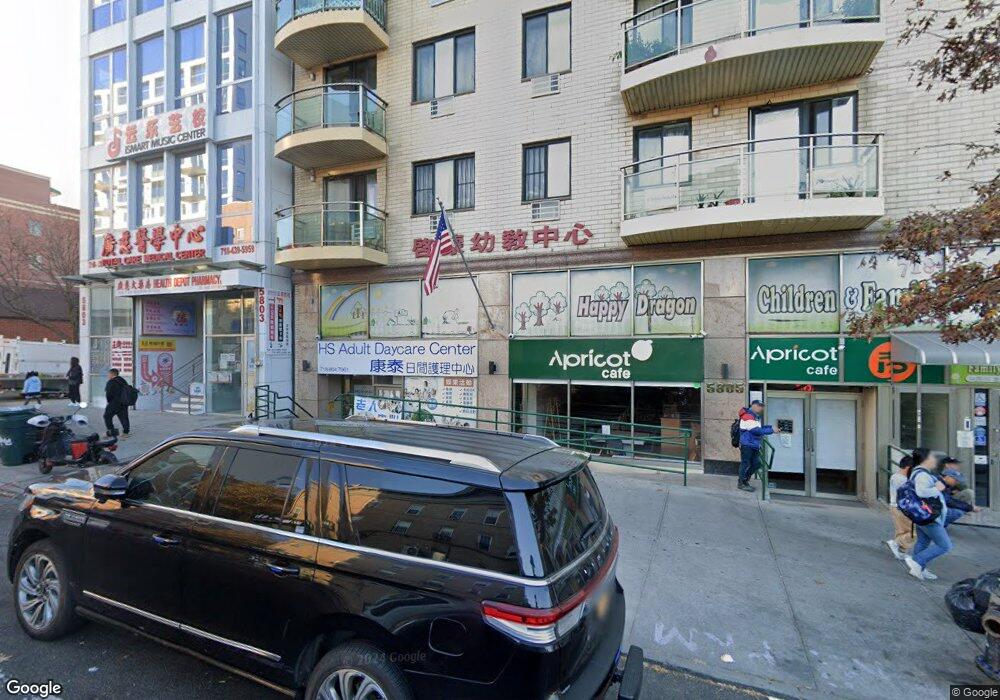
5805 7th Ave Unit 6B Brooklyn, NY 11220
Sunset Park NeighborhoodEstimated Value: $441,000 - $544,000
--
Bed
--
Bath
515
Sq Ft
$946/Sq Ft
Est. Value
About This Home
This home is located at 5805 7th Ave Unit 6B, Brooklyn, NY 11220 and is currently estimated at $487,049, approximately $945 per square foot. 5805 7th Ave Unit 6B is a home located in Kings County with nearby schools including P.S. 69 Vincent D Grippo School, IS 220 John J. Pershing, and Franklin Delano Roosevelt High School.
Ownership History
Date
Name
Owned For
Owner Type
Purchase Details
Closed on
Feb 23, 2021
Sold by
Chan Kin and Estate Of So Kam Chan
Bought by
Ni Ping
Current Estimated Value
Home Financials for this Owner
Home Financials are based on the most recent Mortgage that was taken out on this home.
Original Mortgage
$200,000
Interest Rate
3.1%
Mortgage Type
Purchase Money Mortgage
Purchase Details
Closed on
Sep 3, 2009
Sold by
Hang Seng Capital Group Llc
Bought by
Chan Kin and Chan So Kam
Home Financials for this Owner
Home Financials are based on the most recent Mortgage that was taken out on this home.
Original Mortgage
$160,000
Interest Rate
5.28%
Mortgage Type
Purchase Money Mortgage
Purchase Details
Closed on
May 29, 2007
Sold by
31 East 28Th St Llc and % H Justin Realty Services Llc
Bought by
Homemade Preserves Trust
Create a Home Valuation Report for This Property
The Home Valuation Report is an in-depth analysis detailing your home's value as well as a comparison with similar homes in the area
Home Values in the Area
Average Home Value in this Area
Purchase History
| Date | Buyer | Sale Price | Title Company |
|---|---|---|---|
| Ni Ping | $385,000 | -- | |
| Chan Kin | $250,000 | -- | |
| Chan Kin | $250,000 | -- | |
| Homemade Preserves Trust | $17,500 | -- | |
| Homemade Preserves Trust | $17,500 | -- |
Source: Public Records
Mortgage History
| Date | Status | Borrower | Loan Amount |
|---|---|---|---|
| Previous Owner | Ni Ping | $200,000 | |
| Previous Owner | Chan Kin | $160,000 |
Source: Public Records
Tax History Compared to Growth
Tax History
| Year | Tax Paid | Tax Assessment Tax Assessment Total Assessment is a certain percentage of the fair market value that is determined by local assessors to be the total taxable value of land and additions on the property. | Land | Improvement |
|---|---|---|---|---|
| 2025 | $76 | $43,993 | $3,245 | $40,748 |
| 2024 | $76 | $43,372 | $3,245 | $40,127 |
| 2023 | $76 | $37,438 | $3,245 | $34,193 |
| 2022 | $75 | $35,976 | $3,245 | $32,731 |
| 2021 | $73 | $32,111 | $3,245 | $28,866 |
| 2020 | $75 | $36,804 | $3,245 | $33,559 |
| 2019 | $76 | $36,654 | $3,245 | $33,409 |
| 2018 | $77 | $31,237 | $3,245 | $27,992 |
| 2017 | $77 | $29,811 | $3,245 | $26,566 |
| 2016 | $78 | $27,890 | $3,244 | $24,646 |
| 2015 | $61 | $27,085 | $3,244 | $23,841 |
| 2014 | $61 | $25,532 | $3,244 | $22,288 |
Source: Public Records
Map
Nearby Homes
- 5805 7th Ave Unit 7B
- 5805 7th Ave Unit 7A
- 5805 7th Ave Unit 6D
- 5805 7th Ave Unit 6C
- 5805 7th Ave Unit 6A
- 5805 7th Ave Unit 5E
- 5805 7th Ave Unit 5D
- 5805 7th Ave Unit 5C
- 5805 7th Ave Unit 5B
- 5805 7th Ave Unit 5A
- 5805 7th Ave Unit 4E
- 5805 7th Ave Unit 4D
- 5805 7th Ave Unit 4C
- 5805 7th Ave Unit 4B
- 5805 7th Ave Unit 4A
- 5805 7th Ave Unit 3D
- 5805 7th Ave Unit 3C
- 5805 7th Ave Unit 3B
- 5805 7th Ave Unit 3A
- 5805 7th Ave Unit 2E