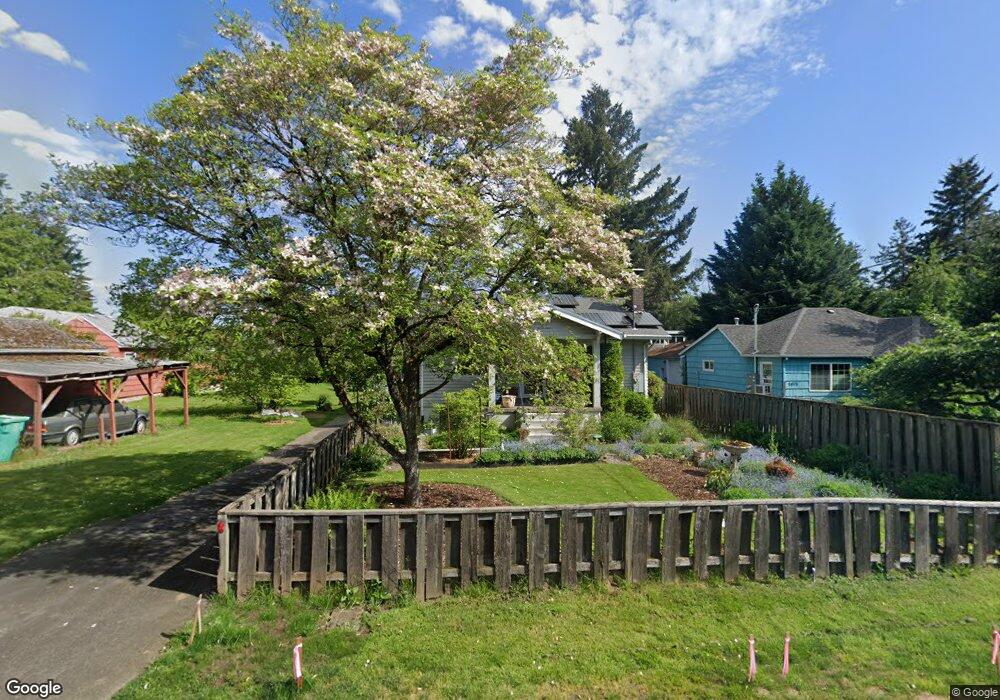
5805 NE Going St Portland, OR 97218
Cully NeighborhoodEstimated Value: $484,000 - $580,000
2
Beds
1
Bath
952
Sq Ft
$563/Sq Ft
Est. Value
About This Home
This home is located at 5805 NE Going St, Portland, OR 97218 and is currently estimated at $535,552, approximately $562 per square foot. 5805 NE Going St is a home located in Multnomah County with nearby schools including Rigler Elementary School, Beaumont Middle School, and Leodis V. McDaniel High School.
Ownership History
Date
Name
Owned For
Owner Type
Purchase Details
Closed on
Aug 25, 2016
Sold by
Estes Donald Bruce
Bought by
Estes Donald Bruce and Estes Susan E
Current Estimated Value
Purchase Details
Closed on
Feb 22, 2010
Sold by
Jennings Wm R and Jennings Jeana D
Bought by
Estes Susan E and Estes Donald Bruce
Purchase Details
Closed on
Jun 25, 2003
Sold by
Draper Susan E
Bought by
Draper Susan E and Estes Donald Bruce
Home Financials for this Owner
Home Financials are based on the most recent Mortgage that was taken out on this home.
Original Mortgage
$118,500
Interest Rate
5.37%
Mortgage Type
Purchase Money Mortgage
Purchase Details
Closed on
Sep 16, 1996
Sold by
Reeck Steven L
Bought by
Draper Susan E
Home Financials for this Owner
Home Financials are based on the most recent Mortgage that was taken out on this home.
Original Mortgage
$107,976
Interest Rate
8.23%
Mortgage Type
FHA
Create a Home Valuation Report for This Property
The Home Valuation Report is an in-depth analysis detailing your home's value as well as a comparison with similar homes in the area
Home Values in the Area
Average Home Value in this Area
Purchase History
| Date | Buyer | Sale Price | Title Company |
|---|---|---|---|
| Estes Donald Bruce | -- | None Available | |
| Estes Susan E | $3,500 | None Available | |
| Draper Susan E | -- | First American | |
| Draper Susan E | $108,427 | Transnation Title Insurance |
Source: Public Records
Mortgage History
| Date | Status | Borrower | Loan Amount |
|---|---|---|---|
| Previous Owner | Draper Susan E | $118,500 | |
| Previous Owner | Draper Susan E | $107,976 |
Source: Public Records
Tax History Compared to Growth
Tax History
| Year | Tax Paid | Tax Assessment Tax Assessment Total Assessment is a certain percentage of the fair market value that is determined by local assessors to be the total taxable value of land and additions on the property. | Land | Improvement |
|---|---|---|---|---|
| 2024 | $5,700 | $213,040 | -- | -- |
| 2023 | $5,481 | $206,840 | $0 | $0 |
| 2022 | $5,362 | $200,820 | $0 | $0 |
| 2021 | $5,272 | $194,975 | $0 | $0 |
| 2020 | $3,886 | $152,100 | $0 | $0 |
| 2019 | $3,743 | $147,670 | $0 | $0 |
| 2018 | $3,633 | $143,370 | $0 | $0 |
| 2017 | $3,482 | $139,200 | $0 | $0 |
| 2016 | $3,187 | $135,150 | $0 | $0 |
| 2015 | $3,103 | $131,220 | $0 | $0 |
| 2014 | $3,056 | $127,400 | $0 | $0 |
Source: Public Records
Map
Nearby Homes
- 5610 NE Going St
- 5906 NE Sumner St
- 6318 NE Prescott St
- 4209 NE 56th Ave
- 4120 NE Cully Blvd Unit 4124
- 0 NE Cully and Ne Mason Blvd Unit 584209199
- 6408 NE Wygant St
- 5819 NE Mason St
- 5757 NE Emerson St
- 5805 NE Shaver St
- 6006 NE Mason St Unit 2
- 6028 NE Mason St Unit 1
- 6010 NE Mason St Unit 6
- 6026 NE Mason St Unit 3
- 6525 NE Prescott St
- 6022 NE Mason St Unit 7
- 6016 NE Mason St Unit 11
- 6020 NE Mason St Unit 9
- 5030 NE Roselawn St
- 4026 NE 64th Ave
- 5815 NE Going St
- 5745 NE Going St
- 5825 NE Going St
- 5835 NE Going St
- 5746 NE Wygant St
- 5733 NE Going St
- 5804 NE Wygant St
- 5723 NE Going St
- 5754 NE Wygant St
- 5816 NE Wygant St
- 5808 NE Going St
- 5816 NE Going St
- 5826 NE Wygant St
- 5855 NE Going St
- 5746 NE Going St
- 5859 NE Going St
- 5726 NE Wygant St
- 5715 NE Going St
- 5832 NE Going St
- 5734 NE Going St