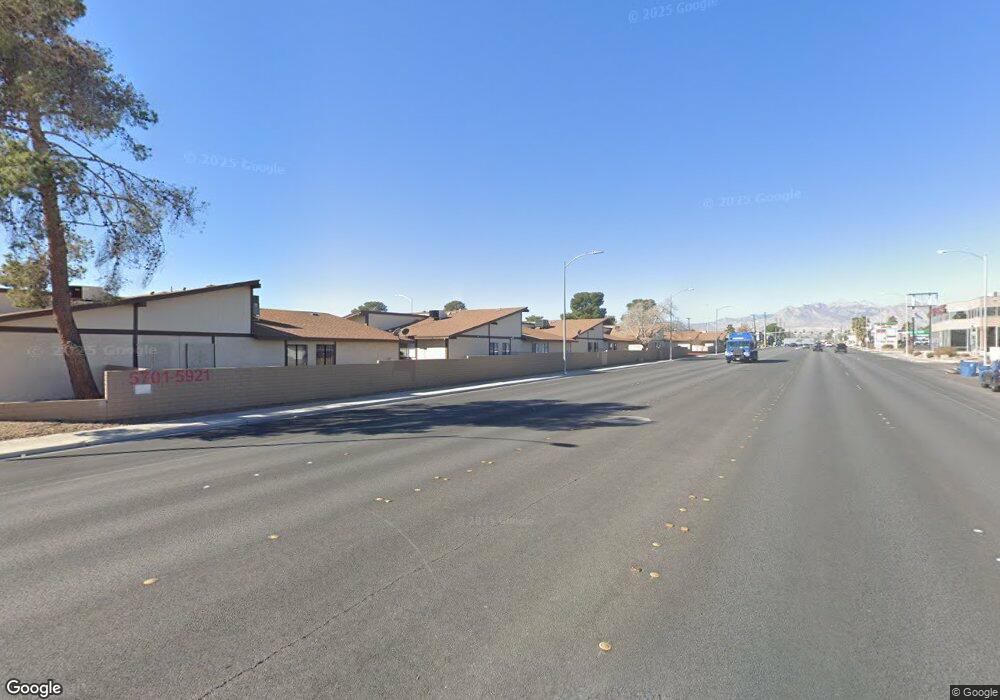
5805 Smoke Ranch Rd Unit C Las Vegas, NV 89108
Michael Way NeighborhoodEstimated Value: $178,000 - $193,000
2
Beds
1
Bath
844
Sq Ft
$222/Sq Ft
Est. Value
About This Home
This home is located at 5805 Smoke Ranch Rd Unit C, Las Vegas, NV 89108 and is currently estimated at $187,001, approximately $221 per square foot. 5805 Smoke Ranch Rd Unit C is a home located in Clark County with nearby schools including Bertha Ronzone Elementary School, J. Harold Brinley Middle School, and Western High School.
Ownership History
Date
Name
Owned For
Owner Type
Purchase Details
Closed on
Nov 17, 2010
Sold by
Aurora Loan Services Llc
Bought by
Idelupe Properties Llc
Current Estimated Value
Purchase Details
Closed on
Aug 10, 2010
Sold by
Tapia Travis N
Bought by
Aurora Loan Services Llc
Purchase Details
Closed on
Feb 12, 2005
Sold by
Garnett Christian D
Bought by
Tapia Travis N
Home Financials for this Owner
Home Financials are based on the most recent Mortgage that was taken out on this home.
Original Mortgage
$97,970
Interest Rate
5.79%
Mortgage Type
FHA
Purchase Details
Closed on
Mar 11, 1998
Sold by
Ashford Park Llc
Bought by
Garnett Christian D
Home Financials for this Owner
Home Financials are based on the most recent Mortgage that was taken out on this home.
Original Mortgage
$56,968
Interest Rate
7.17%
Mortgage Type
FHA
Create a Home Valuation Report for This Property
The Home Valuation Report is an in-depth analysis detailing your home's value as well as a comparison with similar homes in the area
Home Values in the Area
Average Home Value in this Area
Purchase History
| Date | Buyer | Sale Price | Title Company |
|---|---|---|---|
| Idelupe Properties Llc | $27,500 | Ticor Title Las Vegas | |
| Aurora Loan Services Llc | $130,303 | Accommodation | |
| Tapia Travis N | $101,000 | Ticor Title Of Nevada Inc | |
| Garnett Christian D | $58,000 | Stewart Title |
Source: Public Records
Mortgage History
| Date | Status | Borrower | Loan Amount |
|---|---|---|---|
| Previous Owner | Tapia Travis N | $97,970 | |
| Previous Owner | Garnett Christian D | $56,968 |
Source: Public Records
Tax History Compared to Growth
Tax History
| Year | Tax Paid | Tax Assessment Tax Assessment Total Assessment is a certain percentage of the fair market value that is determined by local assessors to be the total taxable value of land and additions on the property. | Land | Improvement |
|---|---|---|---|---|
| 2025 | $552 | $29,152 | $16,100 | $13,052 |
| 2024 | $511 | $29,152 | $16,100 | $13,052 |
| 2023 | $511 | $25,827 | $13,300 | $12,527 |
| 2022 | $474 | $23,033 | $10,850 | $12,183 |
| 2021 | $439 | $20,691 | $10,500 | $10,191 |
| 2020 | $405 | $19,304 | $8,400 | $10,904 |
| 2019 | $379 | $16,960 | $5,950 | $11,010 |
| 2018 | $362 | $15,613 | $4,900 | $10,713 |
| 2017 | $518 | $15,227 | $4,900 | $10,327 |
| 2016 | $340 | $14,715 | $3,850 | $10,865 |
| 2015 | $338 | $13,116 | $3,150 | $9,966 |
| 2014 | $328 | $9,783 | $3,150 | $6,633 |
Source: Public Records
Map
Nearby Homes
- 5817 Smoke Ranch Rd Unit B
- 5905 Smoke Ranch Rd Unit A
- 5917 Smoke Ranch Rd Unit B
- 5701 Smoke Ranch Rd Unit D
- 5705 Stallion Ave
- 5921 San Fernando Dr
- 2341 Canfield Dr Unit B
- 2349 Cardiff Ln Unit B
- 2373 Cardiff Ln Unit B
- 2499 N Jones Blvd
- 5600 W Bartlett Ave
- 5521 Auborn Ave
- 5601 W Bartlett Ave
- 5604 Reiter Ave
- 5600 Balzar Ave
- 6165 Smoke Ranch Rd
- 5537 Cleary Ct
- 2205 San Deluna St
- 5854 Alfred Dr
- 5807 Madre Mesa Dr
- 5805 Smoke Ranch Rd Unit A
- 5805 Smoke Ranch Rd Unit B
- 5801 Smoke Ranch Rd
- 5801 Smoke Ranch Rd Unit C
- 5801 Smoke Ranch Rd Unit A
- 5801 Smoke Ranch Rd Unit D
- 5801 Smoke Ranch Rd Unit B
- 5809 Smoke Ranch Rd Unit C
- 5809 Smoke Ranch Rd Unit A
- 5809 Smoke Ranch Rd Unit B
- 5809 Smoke Ranch Rd Unit D
- 5817 Smoke Ranch Rd Unit A
- 5817 Smoke Ranch Rd Unit D
- 5821 Smoke Ranch Rd Unit 5821
- 5821 Smoke Ranch Rd Unit B
- 5821 Smoke Ranch Rd Unit C
- 5821 Smoke Ranch Rd Unit A
- 5821 Smoke Ranch Rd Unit D
- 5813 Smoke Ranch Rd
- 5813 Smoke Ranch Rd Unit D