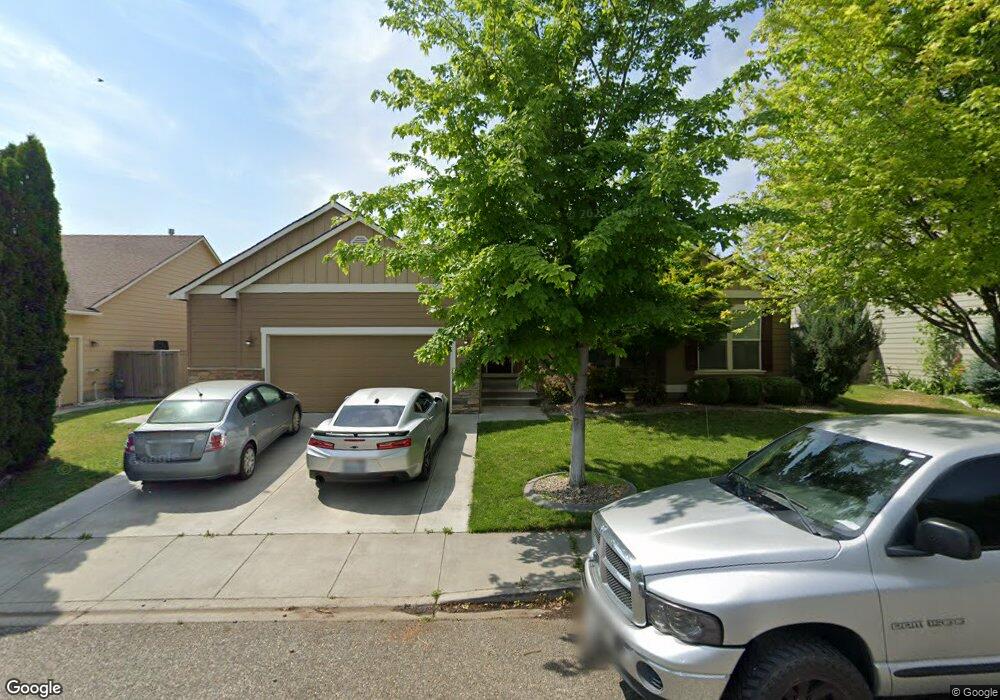
5805 W 14th Ave Unit Imacculate Rambler w Kennewick, WA 99338
Estimated Value: $412,000 - $475,000
4
Beds
2
Baths
1,795
Sq Ft
$247/Sq Ft
Est. Value
About This Home
This home is located at 5805 W 14th Ave Unit Imacculate Rambler w, Kennewick, WA 99338 and is currently estimated at $444,023, approximately $247 per square foot. 5805 W 14th Ave Unit Imacculate Rambler w is a home located in Benton County with nearby schools including Ridge View Elementary School and Southridge High School.
Ownership History
Date
Name
Owned For
Owner Type
Purchase Details
Closed on
Apr 23, 2018
Sold by
Barber Mindy L and Tanimolo Mindy L
Bought by
Stride Edwin D and Stride Constance M
Current Estimated Value
Purchase Details
Closed on
Oct 25, 2012
Sold by
Barber Jared
Bought by
Barber Mindy L and Tanimoto Mindy L
Home Financials for this Owner
Home Financials are based on the most recent Mortgage that was taken out on this home.
Original Mortgage
$204,993
Interest Rate
3.25%
Mortgage Type
FHA
Purchase Details
Closed on
Oct 29, 2009
Sold by
Guerrero Christopher M and Guerrero Kimberly T
Bought by
Tanimoto Mindy I
Home Financials for this Owner
Home Financials are based on the most recent Mortgage that was taken out on this home.
Original Mortgage
$210,123
Interest Rate
5%
Mortgage Type
FHA
Create a Home Valuation Report for This Property
The Home Valuation Report is an in-depth analysis detailing your home's value as well as a comparison with similar homes in the area
Home Values in the Area
Average Home Value in this Area
Purchase History
| Date | Buyer | Sale Price | Title Company |
|---|---|---|---|
| Stride Edwin D | $289,900 | Ticor Title Co | |
| Barber Mindy L | -- | Benton Franklin Title Co | |
| Tanimoto Mindy I | $214,000 | Cascade Title |
Source: Public Records
Mortgage History
| Date | Status | Borrower | Loan Amount |
|---|---|---|---|
| Previous Owner | Barber Mindy L | $204,993 | |
| Previous Owner | Tanimoto Mindy I | $210,123 |
Source: Public Records
Tax History Compared to Growth
Tax History
| Year | Tax Paid | Tax Assessment Tax Assessment Total Assessment is a certain percentage of the fair market value that is determined by local assessors to be the total taxable value of land and additions on the property. | Land | Improvement |
|---|---|---|---|---|
| 2024 | $3,304 | $458,050 | $70,000 | $388,050 |
| 2023 | $3,304 | $413,700 | $70,000 | $343,700 |
| 2022 | $2,852 | $325,000 | $70,000 | $255,000 |
| 2021 | $2,763 | $291,740 | $70,000 | $221,740 |
| 2020 | $2,716 | $274,100 | $46,000 | $228,100 |
| 2019 | $2,490 | $257,810 | $46,000 | $211,810 |
| 2018 | $2,632 | $241,520 | $46,000 | $195,520 |
| 2017 | $2,416 | $208,930 | $46,000 | $162,930 |
| 2016 | $2,850 | $208,930 | $46,000 | $162,930 |
| 2015 | $2,653 | $208,930 | $46,000 | $162,930 |
| 2014 | -- | $191,530 | $42,000 | $149,530 |
| 2013 | -- | $191,530 | $42,000 | $149,530 |
Source: Public Records
Map
Nearby Homes
- 5926 W 16th Ave
- 1102 S Lincoln St
- 5605 W 14th Ave
- 5603 W 15th Ave
- 5805 W 19th Ave
- Lot 12, Phase 8 W 20th Ave Unit Lot12
- Lot 11, Phase 8 W 20th Ave Unit Lot11
- Lot 8, Phase 8 W 20th Ave Unit Lot 8
- Lot 7, Phase 8 W 20th Ave Unit Lot 7
- 6109 W 8th Ave
- 800 S Jefferson St Unit Lot 1
- 6050 W 20th Ave
- 1603 S Fillmore St
- 1705 S Edison St
- 5702 W 23rd Ave
- 5404 W 8th Ave
- 1703 S Quay Ct
- 5304 W 8th Ave
- 1911 S Edison St
- 509 S Kellogg St
- 5805 W 14th Ave Unit Spacious Creekstone
- 5805 W 14th Ave
- 5809 W 14th Ave
- 5801 W 14th Ave
- 5806 W 15th Ave
- 5802 W 15th Ave Unit OPEN HOUSE SAT. JUNE
- 5802 W 15th Ave Unit CREEKSTONE BEAUTY
- 5802 W 15th Ave
- 5810 W 15th Ave
- 5813 W 14th Ave
- 5810 W 14th Ave
- 1315 S Jefferson St
- 5814 W 15th Ave
- 5725 W 14th Ave
- 5817 W 14th Ave Unit 1
- 5726 W 15th Ave
- 1311 S Jefferson Place
- 1310 S Jefferson St
- 5728 W 14th Ave
- 1313 S Jefferson St Unit Needs to Move