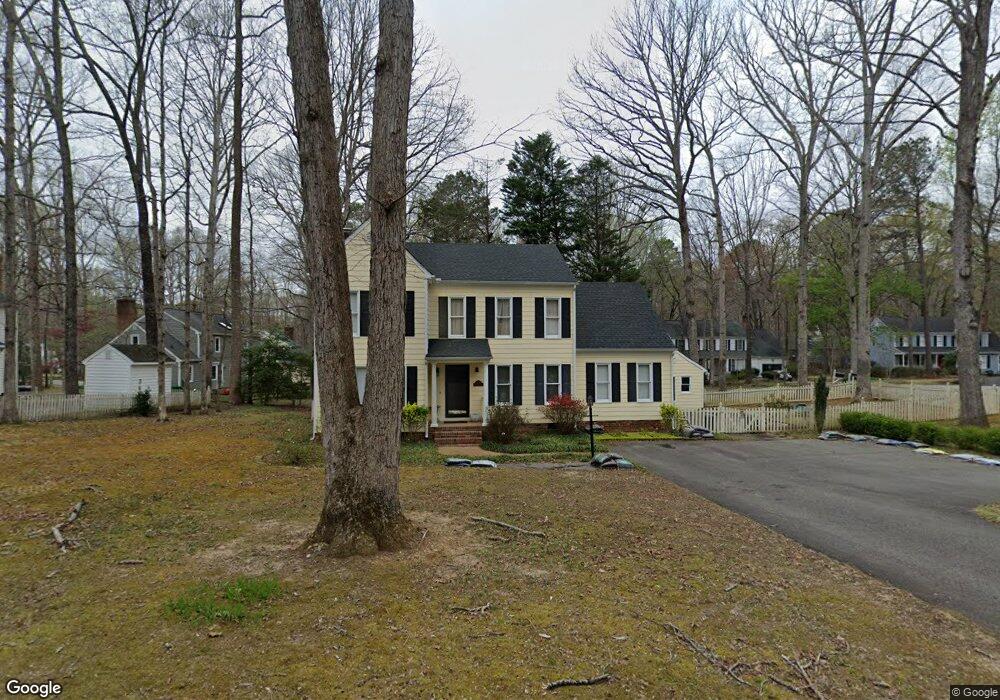
5806 Bent Creek Rd Midlothian, VA 23112
Estimated Value: $420,000 - $468,084
4
Beds
3
Baths
1,977
Sq Ft
$227/Sq Ft
Est. Value
About This Home
This home is located at 5806 Bent Creek Rd, Midlothian, VA 23112 and is currently estimated at $449,521, approximately $227 per square foot. 5806 Bent Creek Rd is a home located in Chesterfield County with nearby schools including Clover Hill Elementary School, Tomahawk Creek Middle School, and Cosby High School.
Ownership History
Date
Name
Owned For
Owner Type
Purchase Details
Closed on
Jul 11, 2018
Sold by
Irvine Matthew H
Bought by
Browne Margaret Angela and Mugan Walter
Current Estimated Value
Home Financials for this Owner
Home Financials are based on the most recent Mortgage that was taken out on this home.
Original Mortgage
$267,720
Outstanding Balance
$232,532
Interest Rate
4.6%
Mortgage Type
New Conventional
Estimated Equity
$216,989
Purchase Details
Closed on
May 23, 2006
Sold by
Eister Mark
Bought by
Irvine Matthew
Home Financials for this Owner
Home Financials are based on the most recent Mortgage that was taken out on this home.
Original Mortgage
$221,400
Interest Rate
6.62%
Mortgage Type
New Conventional
Purchase Details
Closed on
Apr 4, 2005
Sold by
Winant Mark
Bought by
Eister Mark
Home Financials for this Owner
Home Financials are based on the most recent Mortgage that was taken out on this home.
Original Mortgage
$211,450
Interest Rate
5.7%
Mortgage Type
VA
Create a Home Valuation Report for This Property
The Home Valuation Report is an in-depth analysis detailing your home's value as well as a comparison with similar homes in the area
Home Values in the Area
Average Home Value in this Area
Purchase History
| Date | Buyer | Sale Price | Title Company |
|---|---|---|---|
| Browne Margaret Angela | $276,000 | Day Title Services Lc | |
| Irvine Matthew | $246,000 | -- | |
| Eister Mark | $207,000 | -- |
Source: Public Records
Mortgage History
| Date | Status | Borrower | Loan Amount |
|---|---|---|---|
| Open | Browne Margaret Angela | $267,720 | |
| Previous Owner | Irvine Matthew | $221,400 | |
| Previous Owner | Eister Mark | $211,450 |
Source: Public Records
Tax History
| Year | Tax Paid | Tax Assessment Tax Assessment Total Assessment is a certain percentage of the fair market value that is determined by local assessors to be the total taxable value of land and additions on the property. | Land | Improvement |
|---|---|---|---|---|
| 2025 | $3,973 | $443,600 | $75,000 | $368,600 |
| 2024 | $3,973 | $429,100 | $75,000 | $354,100 |
| 2023 | $3,605 | $396,100 | $70,000 | $326,100 |
| 2022 | $3,264 | $354,800 | $67,000 | $287,800 |
| 2021 | $3,064 | $315,600 | $65,000 | $250,600 |
| 2020 | $2,871 | $302,200 | $65,000 | $237,200 |
| 2019 | $2,727 | $287,000 | $63,000 | $224,000 |
| 2018 | $2,458 | $258,300 | $60,000 | $198,300 |
| 2017 | $2,413 | $246,100 | $57,000 | $189,100 |
| 2016 | $2,286 | $238,100 | $54,000 | $184,100 |
| 2015 | $2,251 | $231,900 | $53,000 | $178,900 |
| 2014 | $2,163 | $222,700 | $52,000 | $170,700 |
Source: Public Records
Map
Nearby Homes
- 14403 Shelter Cove Rd
- 14701 Duck Cove Place
- 14720 Ridge Point Dr
- 14717 Beacon Hill Ct
- 14723 Beacon Hill Ct
- 5609 Chatmoss Rd
- 5601 Sandstone Ridge Rd
- 5604 Fiddlers Ridge Ln
- 5512 Fiddlers Ridge Ln
- 14906 Orchard Grove Dr
- 5311 Chestnut Bluff Place
- 6505 Walnut Bend Ct
- 112 Water Pointe Ct
- 12813 Deep Well Rd
- 14437 Duckridge Terrace
- 5305 Meadow Chase Ln
- 13904 Sunrise Bluff Rd
- 14914 Highberry Woods Terrace
- 14409 Clipper Cove Ct
- 13805 Beechwood Point Cir
- 5804 Bent Creek Rd
- 14500 Bent Creek Ct
- 14502 Bent Creek Ct
- 5811 Bent Creek Rd
- 5802 Bent Creek Rd
- 5809 Bent Creek Rd
- 5800 Bent Creek Rd
- 5807 Bent Creek Rd
- 14504 Bent Creek Ct
- 14406 Bent Creek Place
- 5801 Bent Creek Rd
- 14404 Bent Creek Place
- 5805 Bent Creek Rd
- 5803 Bent Creek Rd
- 5808 Oak Knoll Rd
- 14501 Bent Creek Ct
- 5806 Oak Knoll Rd
- 14506 Bent Creek Ct
- 14503 Bent Creek Ct
- 14402 Bent Creek Place
Your Personal Tour Guide
Ask me questions while you tour the home.