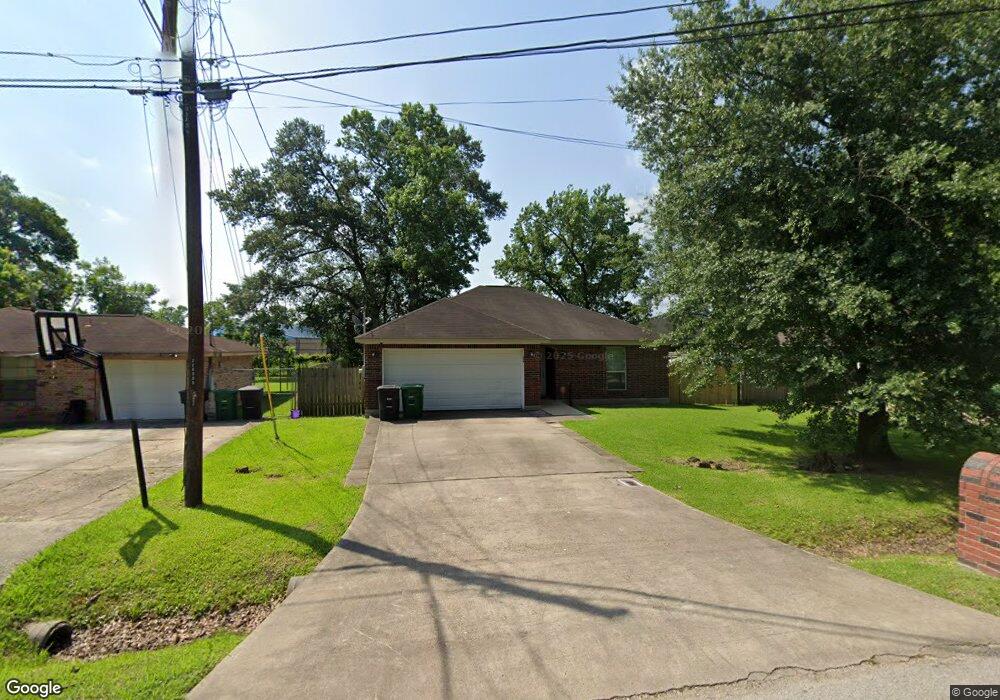
5806 Rietta St Houston, TX 77016
East Little York NeighborhoodEstimated Value: $201,953 - $221,000
3
Beds
2
Baths
1,700
Sq Ft
$124/Sq Ft
Est. Value
About This Home
This home is located at 5806 Rietta St, Houston, TX 77016 and is currently estimated at $211,238, approximately $124 per square foot. 5806 Rietta St is a home located in Harris County with nearby schools including Shadydale Elementary School, Forest Brook Middle, and North Forest High School.
Ownership History
Date
Name
Owned For
Owner Type
Purchase Details
Closed on
Apr 25, 2011
Sold by
Fannie Mae
Bought by
Ortiz Luis Enrique
Current Estimated Value
Home Financials for this Owner
Home Financials are based on the most recent Mortgage that was taken out on this home.
Original Mortgage
$74,073
Outstanding Balance
$51,151
Interest Rate
4.82%
Mortgage Type
FHA
Estimated Equity
$160,087
Purchase Details
Closed on
Sep 9, 2010
Sold by
Pnc Mortgage
Bought by
Federal National Mortgage Association
Purchase Details
Closed on
Sep 7, 2010
Sold by
Denton Julien
Bought by
Pnc Mortgage
Purchase Details
Closed on
Sep 8, 2006
Sold by
Jefferson Dewey S and Jefferson Brenda C
Bought by
Denton Julien
Home Financials for this Owner
Home Financials are based on the most recent Mortgage that was taken out on this home.
Original Mortgage
$110,000
Interest Rate
6.64%
Mortgage Type
Purchase Money Mortgage
Create a Home Valuation Report for This Property
The Home Valuation Report is an in-depth analysis detailing your home's value as well as a comparison with similar homes in the area
Home Values in the Area
Average Home Value in this Area
Purchase History
| Date | Buyer | Sale Price | Title Company |
|---|---|---|---|
| Ortiz Luis Enrique | -- | Etc | |
| Federal National Mortgage Association | -- | None Available | |
| Pnc Mortgage | $79,374 | None Available | |
| Denton Julien | -- | Etc |
Source: Public Records
Mortgage History
| Date | Status | Borrower | Loan Amount |
|---|---|---|---|
| Open | Ortiz Luis Enrique | $74,073 | |
| Previous Owner | Denton Julien | $110,000 |
Source: Public Records
Tax History Compared to Growth
Tax History
| Year | Tax Paid | Tax Assessment Tax Assessment Total Assessment is a certain percentage of the fair market value that is determined by local assessors to be the total taxable value of land and additions on the property. | Land | Improvement |
|---|---|---|---|---|
| 2025 | $1,595 | $186,888 | $52,148 | $134,740 |
| 2024 | $1,595 | $177,170 | $45,419 | $131,751 |
| 2023 | $1,595 | $180,842 | $28,597 | $152,245 |
| 2022 | $2,673 | $153,297 | $28,597 | $124,700 |
| 2021 | $2,572 | $141,487 | $20,186 | $121,301 |
| 2020 | $2,429 | $113,065 | $20,186 | $92,879 |
| 2019 | $2,308 | $99,721 | $14,130 | $85,591 |
| 2018 | $1,385 | $82,912 | $11,775 | $71,137 |
| 2017 | $1,910 | $82,912 | $11,775 | $71,137 |
| 2016 | $1,736 | $68,667 | $7,065 | $61,602 |
| 2015 | $1,240 | $68,667 | $7,065 | $61,602 |
| 2014 | $1,240 | $68,667 | $7,065 | $61,602 |
Source: Public Records
Map
Nearby Homes
- 9711 Bertwood St
- 5715 Rietta St
- 5713 Rietta St
- 9603 Bertwood St
- 9410 Dandy St
- 5914 Breland St
- 4708 Antha St
- 9421 Sandra St
- 5203 Mayle St
- 5125 Mayle St
- 6206 Antha St
- 9325 Grady St
- 6226 E Tidwell Rd
- 9705 Peachtree St
- 9838 Camay Dr
- 8504 Shady Dr
- 9118 Sandra St Unit A and B
- 5009 Tidwell Rd
- 6110 Tidwell Rd
- 4917 Tronewood St