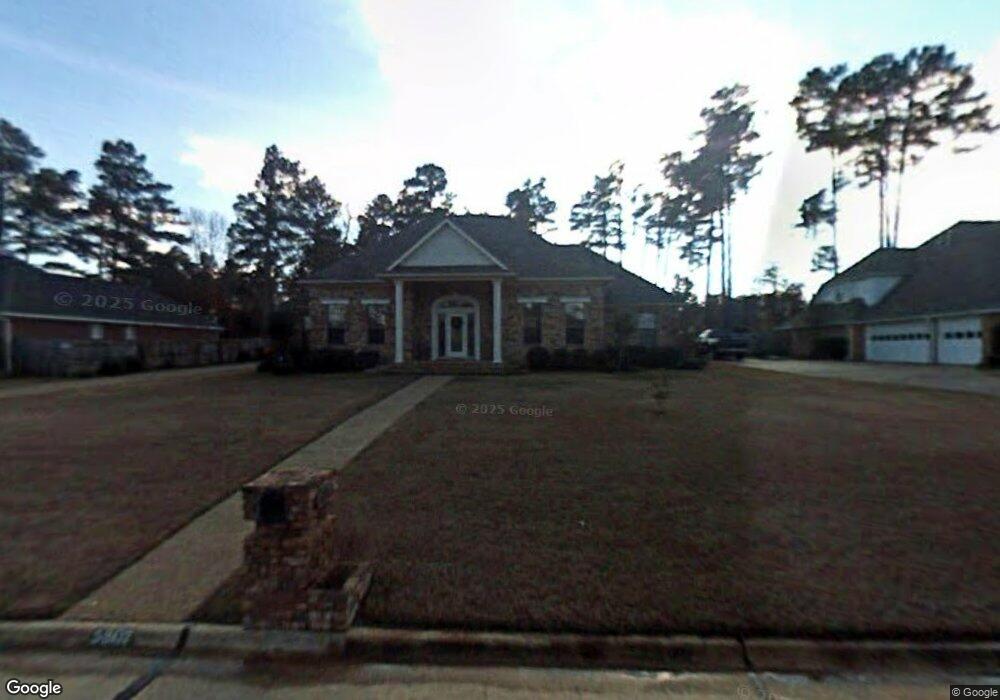
5807 Winchester Dr Texarkana, TX 75503
Estimated Value: $397,000 - $502,000
3
Beds
3
Baths
2,330
Sq Ft
$191/Sq Ft
Est. Value
About This Home
This home is located at 5807 Winchester Dr, Texarkana, TX 75503 and is currently estimated at $445,177, approximately $191 per square foot. 5807 Winchester Dr is a home located in Bowie County with nearby schools including Waggoner Creek Elementary School, Texas Middle School, and Texas High School.
Ownership History
Date
Name
Owned For
Owner Type
Purchase Details
Closed on
Apr 6, 2016
Sold by
Benton Willie R and Benton Vicky S
Bought by
Spencer Charles H and Spencer Julie A
Current Estimated Value
Home Financials for this Owner
Home Financials are based on the most recent Mortgage that was taken out on this home.
Original Mortgage
$250,282
Outstanding Balance
$197,104
Interest Rate
3.5%
Mortgage Type
FHA
Estimated Equity
$248,073
Purchase Details
Closed on
Mar 28, 2014
Sold by
Robinson Stephen W and Robinson Judith E
Bought by
Benton Willie R and Benton Vicky S
Home Financials for this Owner
Home Financials are based on the most recent Mortgage that was taken out on this home.
Original Mortgage
$216,750
Interest Rate
4.5%
Mortgage Type
Adjustable Rate Mortgage/ARM
Create a Home Valuation Report for This Property
The Home Valuation Report is an in-depth analysis detailing your home's value as well as a comparison with similar homes in the area
Home Values in the Area
Average Home Value in this Area
Purchase History
| Date | Buyer | Sale Price | Title Company |
|---|---|---|---|
| Spencer Charles H | -- | Stewart Title | |
| Benton Willie R | -- | Stewart Title Of Texarkana |
Source: Public Records
Mortgage History
| Date | Status | Borrower | Loan Amount |
|---|---|---|---|
| Open | Spencer Charles H | $250,282 | |
| Previous Owner | Benton Willie R | $216,750 |
Source: Public Records
Tax History Compared to Growth
Tax History
| Year | Tax Paid | Tax Assessment Tax Assessment Total Assessment is a certain percentage of the fair market value that is determined by local assessors to be the total taxable value of land and additions on the property. | Land | Improvement |
|---|---|---|---|---|
| 2025 | $6,334 | $375,397 | $30,000 | $345,397 |
| 2024 | $6,334 | $365,586 | $30,000 | $335,586 |
| 2023 | $8,001 | $337,909 | $0 | $0 |
| 2022 | $7,333 | $327,490 | $30,000 | $297,490 |
| 2021 | $7,141 | $279,264 | $30,000 | $249,264 |
| 2020 | $6,951 | $270,386 | $30,000 | $240,386 |
| 2019 | $6,916 | $259,267 | $30,000 | $229,267 |
| 2018 | $6,755 | $253,248 | $30,000 | $223,248 |
| 2017 | $6,282 | $236,178 | $30,000 | $206,178 |
| 2016 | $6,127 | $230,317 | $30,000 | $200,317 |
| 2015 | $3,822 | $228,416 | $30,000 | $198,416 |
| 2014 | $3,822 | $222,794 | $30,000 | $192,794 |
Source: Public Records
Map
Nearby Homes
- 6404 N Park Rd
- 5818 Winchester Dr
- 5906 Winchester Dr
- 1521 Moores Ln
- 6705 N Park Rd
- 16 Bill Rogers Dr
- 5 Cindywood Dr
- 46 Enclave Cir
- 25 Shields Ct
- 24 Shields Ct
- 25 Enclave Cir
- 23 Enclave Cir
- 10 Enclave Cir
- 4 Enclave Cir
- 36 Enclave Cir
- 30 Enclave Cir
- 34 Enclave Cir
- 6 Enclave Cir
- 3 Enclave Cir
- 14 Enclave Cir
- 5809 Winchester Dr
- 5805 Winchester Dr
- 5811 Winchester Dr
- 6402 N Park Rd
- 6306 N Park Rd
- 5816 Winchester Dr
- 5803 Winchester Dr
- 6304 N Park Rd
- 5813 Winchester Dr
- 5812 Winchester Dr
- 5 Gregory Ln
- 5815 Winchester Dr
- 4 Gregory Ln
- 3 Gregory Ln
- 6209 N Park Rd
- 5904 Winchester Dr
- 1 Bill Rogers Dr
- 5806 Winchester Dr
- 5817 Winchester Dr
- 5804 Winchester Dr