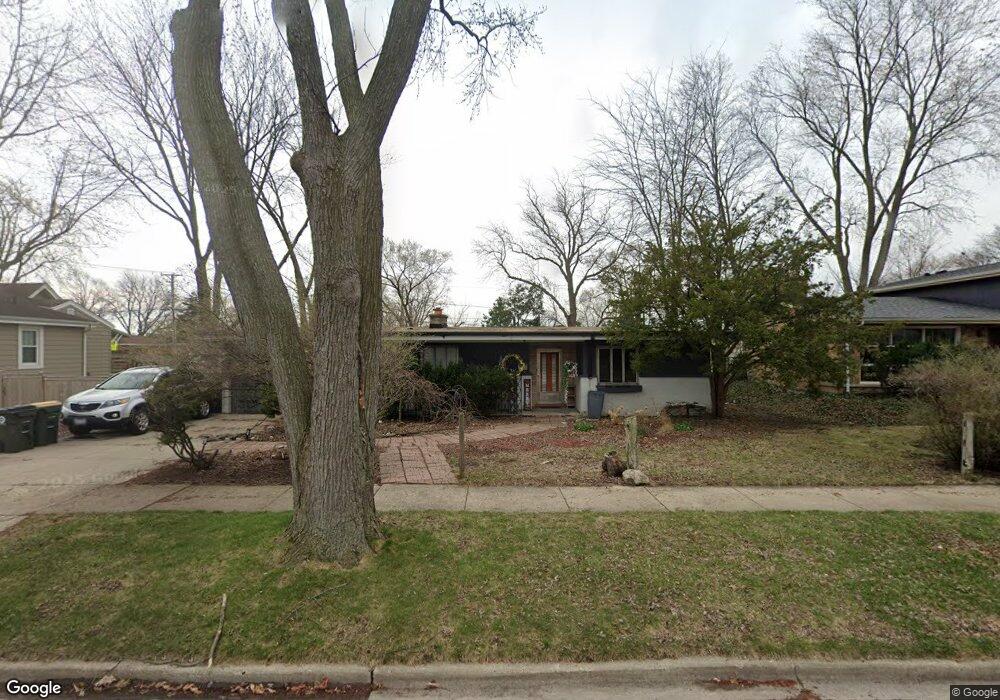
5809 Keeney St Morton Grove, IL 60053
Estimated Value: $385,000 - $460,863
4
Beds
3
Baths
1,641
Sq Ft
$265/Sq Ft
Est. Value
About This Home
This home is located at 5809 Keeney St, Morton Grove, IL 60053 and is currently estimated at $434,466, approximately $264 per square foot. 5809 Keeney St is a home located in Cook County with nearby schools including Madison Elementary School, Thomas Edison Elementary School, and Lincoln Junior High School.
Ownership History
Date
Name
Owned For
Owner Type
Purchase Details
Closed on
Sep 15, 2025
Sold by
Kerman Yvonne M and Crump Mylene D
Bought by
Crump Mylene D
Current Estimated Value
Create a Home Valuation Report for This Property
The Home Valuation Report is an in-depth analysis detailing your home's value as well as a comparison with similar homes in the area
Home Values in the Area
Average Home Value in this Area
Purchase History
| Date | Buyer | Sale Price | Title Company |
|---|---|---|---|
| Crump Mylene D | -- | None Listed On Document |
Source: Public Records
Tax History Compared to Growth
Tax History
| Year | Tax Paid | Tax Assessment Tax Assessment Total Assessment is a certain percentage of the fair market value that is determined by local assessors to be the total taxable value of land and additions on the property. | Land | Improvement |
|---|---|---|---|---|
| 2024 | $5,249 | $18,725 | $5,320 | $13,405 |
| 2023 | $5,152 | $18,725 | $5,320 | $13,405 |
| 2022 | $5,152 | $18,725 | $5,320 | $13,405 |
| 2021 | $3,987 | $13,400 | $3,273 | $10,127 |
| 2020 | $4,024 | $13,400 | $3,273 | $10,127 |
| 2019 | $4,015 | $15,057 | $3,273 | $11,784 |
| 2018 | $5,378 | $16,048 | $2,966 | $13,082 |
| 2017 | $5,402 | $16,048 | $2,966 | $13,082 |
| 2016 | $5,223 | $16,048 | $2,966 | $13,082 |
| 2015 | $4,615 | $13,699 | $2,557 | $11,142 |
| 2014 | $4,532 | $13,699 | $2,557 | $11,142 |
| 2013 | $4,510 | $13,699 | $2,557 | $11,142 |
Source: Public Records
Map
Nearby Homes
- 8306 Central Ave
- 5505 Oakton St
- 5501 Mulford St
- 5500 Harvard Terrace
- 6163 Mayfair St Unit 102714
- 5501 Lincoln Ave Unit 203
- 8349 N Merrimac Ave
- 8348 N Merrimac Ave
- 6166 Mayfair St Unit 33714
- 6035 Lincoln Ave
- 5510 Lincoln Ave Unit B301
- 5506 Lincoln Ave Unit A117
- 5510 Lincoln Ave Unit B101
- 5500 Lincoln Ave Unit 319E
- 5500 Lincoln Ave Unit 109W
- 5500 Lincoln Ave Unit 407W
- 5500 Lincoln Ave Unit 116E
- 8300 Callie Ave Unit F610
- 8300 Callie Ave Unit F311
- 8300 Callie Ave Unit F314