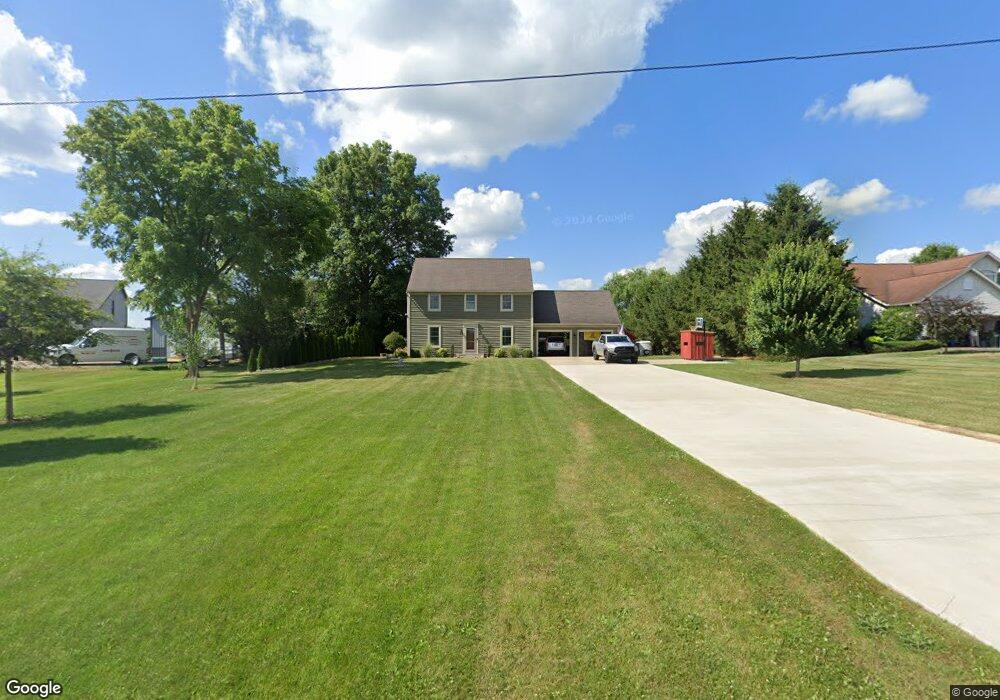
5809 Tyro St NE Canton, OH 44721
Estimated Value: $281,288 - $348,000
3
Beds
3
Baths
1,904
Sq Ft
$164/Sq Ft
Est. Value
About This Home
This home is located at 5809 Tyro St NE, Canton, OH 44721 and is currently estimated at $313,072, approximately $164 per square foot. 5809 Tyro St NE is a home located in Stark County with nearby schools including Marlington High School.
Ownership History
Date
Name
Owned For
Owner Type
Purchase Details
Closed on
Apr 16, 2018
Sold by
Mansfield Harold P and Mansfield Heidi L
Bought by
Mansfield Harold P and Mansfield Heidi L
Current Estimated Value
Purchase Details
Closed on
Aug 1, 2011
Sold by
Wells Fargo Bank Na
Bought by
Mansfield Harold P and Mansfield Heidi L
Home Financials for this Owner
Home Financials are based on the most recent Mortgage that was taken out on this home.
Original Mortgage
$145,201
Outstanding Balance
$99,735
Interest Rate
4.4%
Mortgage Type
Seller Take Back
Estimated Equity
$213,337
Purchase Details
Closed on
Jun 8, 2011
Sold by
Hostetler Jesse L and Hostetler Christa F
Bought by
Wells Fargo Bank Na
Home Financials for this Owner
Home Financials are based on the most recent Mortgage that was taken out on this home.
Original Mortgage
$145,201
Outstanding Balance
$99,735
Interest Rate
4.4%
Mortgage Type
Seller Take Back
Estimated Equity
$213,337
Purchase Details
Closed on
Jun 5, 2002
Sold by
21St Homes Inc
Bought by
Hostetler Jesse L and Hostetler Crista F
Home Financials for this Owner
Home Financials are based on the most recent Mortgage that was taken out on this home.
Original Mortgage
$169,020
Interest Rate
6.54%
Mortgage Type
Construction
Create a Home Valuation Report for This Property
The Home Valuation Report is an in-depth analysis detailing your home's value as well as a comparison with similar homes in the area
Purchase History
| Date | Buyer | Sale Price | Title Company |
|---|---|---|---|
| Mansfield Harold P | -- | None Available | |
| Mansfield Harold P | $140,125 | Servicelink | |
| Wells Fargo Bank Na | $110,000 | Attorney | |
| Hostetler Jesse L | $28,000 | -- |
Source: Public Records
Mortgage History
| Date | Status | Borrower | Loan Amount |
|---|---|---|---|
| Open | Mansfield Harold P | $145,201 | |
| Previous Owner | Hostetler Jesse L | $169,020 |
Source: Public Records
Tax History
| Year | Tax Paid | Tax Assessment Tax Assessment Total Assessment is a certain percentage of the fair market value that is determined by local assessors to be the total taxable value of land and additions on the property. | Land | Improvement |
|---|---|---|---|---|
| 2025 | -- | $75,430 | $13,650 | $61,780 |
| 2024 | -- | $75,430 | $13,650 | $61,780 |
| 2023 | $2,401 | $65,280 | $10,990 | $54,290 |
| 2022 | $1,205 | $65,280 | $10,990 | $54,290 |
| 2021 | $2,417 | $65,280 | $10,990 | $54,290 |
| 2020 | $2,233 | $55,270 | $9,240 | $46,030 |
| 2019 | $2,217 | $55,280 | $9,250 | $46,030 |
Source: Public Records
Map
Nearby Homes
- 10366 Immel Ave NE
- 10366 Immel St NE
- 0 Pilot Knob Ave NE
- 6920 Nimishillen Church St
- 3359 Nimishillen Church Rd NE
- 3212 Foxmoor St NE
- 10299 Hunting Hills Ave NE
- 10311 Hunting Hills Ave NE
- 3445 Cheyenne Trail NE
- 3404 Wicker St NE
- 11585 El Dorado Cir NE
- 0 Fiddler Court Cir NE
- 7674 Knollridge Ave NE
- 7606 Knollridge Ave NE
- 8294 Turquoise Ave NE
- 7705 Ravenna Ave
- 3773 Northern St NE
- 7844 Morningstar Dr
- 7431 Middlebranch Ave NE
- 8060 Garnet Ave NE
- 5837 Tyro St NE
- 5785 Tyro St NE
- 5851 Tyro St NE
- 5873 Tyro St NE
- 5725 Tyro St NE
- 5864 Tyro St NE
- 10143 Immel St NE
- 10001 Immel St NE
- 10083 Immel St NE
- 5647 Tyro St NE
- 5646 Tyro St NE
- 5646 Tyro St NE
- 6020 Tyro St
- 10131 Immel St NE
- 10112 Immel Ave NE
- 5600 Tyro St NE
- 10165 Immel St NE
- 5619 Tyro St NE
- 6009 Tyro St NE
- 10167 Immel St NE
Your Personal Tour Guide
Ask me questions while you tour the home.