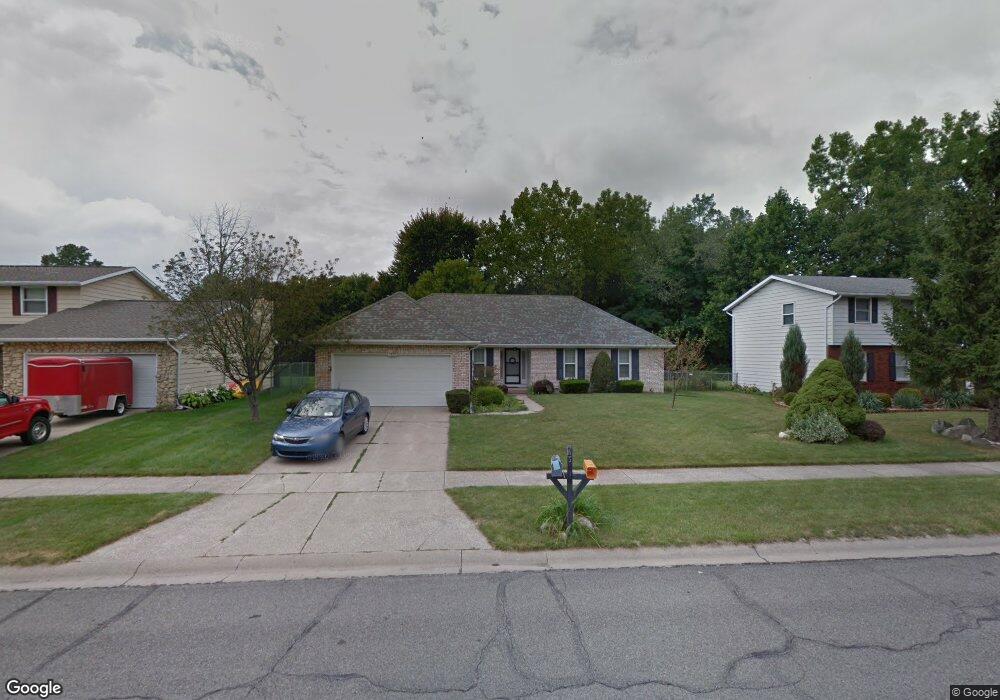
5809 York Rd South Bend, IN 46614
Estimated Value: $272,000 - $289,535
3
Beds
1
Bath
797
Sq Ft
$352/Sq Ft
Est. Value
About This Home
This home is located at 5809 York Rd, South Bend, IN 46614 and is currently estimated at $280,634, approximately $352 per square foot. 5809 York Rd is a home located in St. Joseph County with nearby schools including Hay Elementary School, Jackson Middle School, and Riley High School.
Ownership History
Date
Name
Owned For
Owner Type
Purchase Details
Closed on
Dec 10, 2024
Sold by
Neland Lee A
Bought by
Musasa Ernest
Current Estimated Value
Home Financials for this Owner
Home Financials are based on the most recent Mortgage that was taken out on this home.
Original Mortgage
$274,928
Outstanding Balance
$272,736
Interest Rate
6.72%
Mortgage Type
FHA
Estimated Equity
$7,898
Purchase Details
Closed on
Aug 29, 2005
Sold by
Wise Sharon and Allen Frank H
Bought by
Neland Lee A
Home Financials for this Owner
Home Financials are based on the most recent Mortgage that was taken out on this home.
Original Mortgage
$121,600
Interest Rate
5.82%
Mortgage Type
New Conventional
Create a Home Valuation Report for This Property
The Home Valuation Report is an in-depth analysis detailing your home's value as well as a comparison with similar homes in the area
Home Values in the Area
Average Home Value in this Area
Purchase History
| Date | Buyer | Sale Price | Title Company |
|---|---|---|---|
| Musasa Ernest | -- | Meridian Title | |
| Neland Lee A | -- | Meridian Title Corp |
Source: Public Records
Mortgage History
| Date | Status | Borrower | Loan Amount |
|---|---|---|---|
| Open | Musasa Ernest | $274,928 | |
| Previous Owner | Neland Lee A | $121,600 |
Source: Public Records
Tax History Compared to Growth
Tax History
| Year | Tax Paid | Tax Assessment Tax Assessment Total Assessment is a certain percentage of the fair market value that is determined by local assessors to be the total taxable value of land and additions on the property. | Land | Improvement |
|---|---|---|---|---|
| 2024 | $3,161 | $263,000 | $38,500 | $224,500 |
| 2023 | $3,118 | $262,400 | $38,500 | $223,900 |
| 2022 | $2,916 | $241,700 | $38,500 | $203,200 |
| 2021 | $2,627 | $215,300 | $31,700 | $183,600 |
| 2020 | $2,322 | $191,100 | $27,600 | $163,500 |
| 2019 | $2,014 | $197,100 | $26,300 | $170,800 |
| 2018 | $2,088 | $173,300 | $22,900 | $150,400 |
| 2017 | $1,854 | $149,100 | $20,200 | $128,900 |
| 2016 | $1,888 | $149,100 | $20,200 | $128,900 |
| 2014 | $1,895 | $151,500 | $20,200 | $131,300 |
Source: Public Records
Map
Nearby Homes
- 5912 York Rd
- 5653 Danbury Dr
- 5602 Cape Cod Ln
- 1834 Saint Michaels Ct
- 1961 E Farnsworth Dr
- 5434 Raleigh Dr
- 5635 Miami St
- 1225 Fairfax Dr
- 5627 Garden Terrace
- 60506 Woodstock Dr
- 4909 Selkirk Dr
- 1951 Broadford Dr
- 1957 Broadford Dr
- 5173 Finch Dr
- 872 Nutmeg Ct
- 1719 Thornhill Dr
- 1725 Thornhill Dr
- 737 Dice Ct Unit 93
- The Leahy Plan at Royal Oak Estates
- The Kelley Plan at Royal Oak Estates