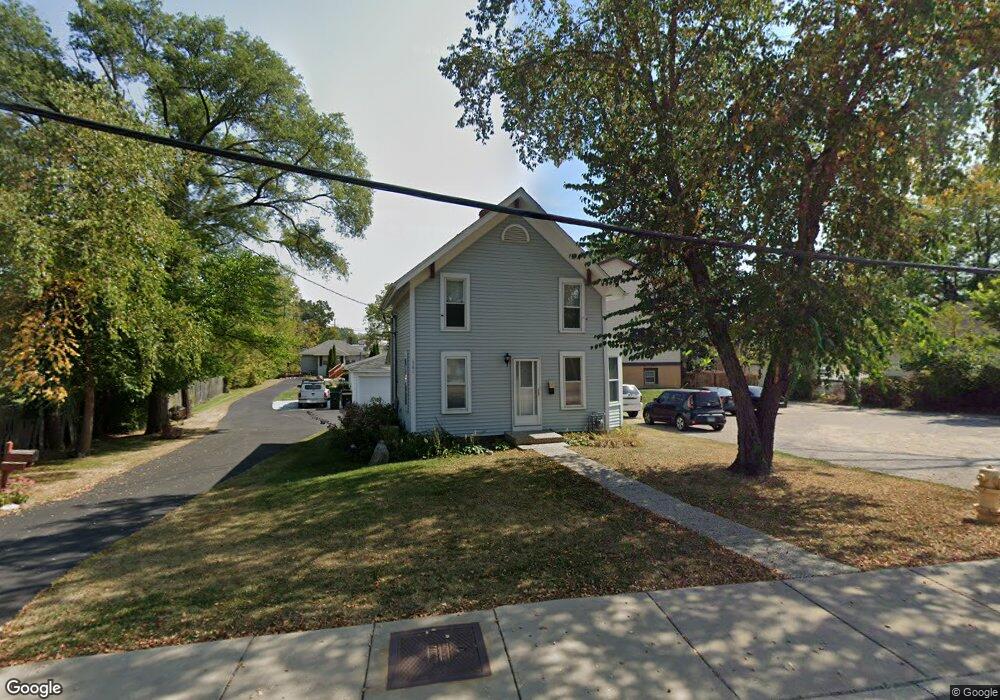
581 Main St Antioch, IL 60002
Estimated Value: $204,823 - $232,000
2
Beds
1
Bath
990
Sq Ft
$224/Sq Ft
Est. Value
About This Home
This home is located at 581 Main St, Antioch, IL 60002 and is currently estimated at $221,706, approximately $223 per square foot. 581 Main St is a home located in Lake County with nearby schools including Antioch Community High School.
Ownership History
Date
Name
Owned For
Owner Type
Purchase Details
Closed on
Apr 30, 2004
Sold by
Johnson Billy L and Johnson Rosalie L
Bought by
Harrison Rickey L
Current Estimated Value
Home Financials for this Owner
Home Financials are based on the most recent Mortgage that was taken out on this home.
Original Mortgage
$123,500
Interest Rate
5.91%
Mortgage Type
Purchase Money Mortgage
Purchase Details
Closed on
Jul 25, 2002
Sold by
Domek Theodore E and Domek Kimberly L
Bought by
Johnson Billy L and Johnson Rosalie L
Home Financials for this Owner
Home Financials are based on the most recent Mortgage that was taken out on this home.
Original Mortgage
$127,500
Interest Rate
6.63%
Mortgage Type
VA
Purchase Details
Closed on
Jul 27, 1995
Sold by
Huber Joseph A
Bought by
Domek Theodore E and Domek Kimberly L
Home Financials for this Owner
Home Financials are based on the most recent Mortgage that was taken out on this home.
Original Mortgage
$82,822
Interest Rate
7.59%
Mortgage Type
FHA
Create a Home Valuation Report for This Property
The Home Valuation Report is an in-depth analysis detailing your home's value as well as a comparison with similar homes in the area
Home Values in the Area
Average Home Value in this Area
Purchase History
| Date | Buyer | Sale Price | Title Company |
|---|---|---|---|
| Harrison Rickey L | $130,000 | First American Title Insuran | |
| Johnson Billy L | $125,000 | -- | |
| Domek Theodore E | $86,000 | -- |
Source: Public Records
Mortgage History
| Date | Status | Borrower | Loan Amount |
|---|---|---|---|
| Closed | Harrison Rickey L | $123,500 | |
| Previous Owner | Johnson Billy L | $127,500 | |
| Previous Owner | Domek Theodore E | $82,822 |
Source: Public Records
Tax History
| Year | Tax Paid | Tax Assessment Tax Assessment Total Assessment is a certain percentage of the fair market value that is determined by local assessors to be the total taxable value of land and additions on the property. | Land | Improvement |
|---|---|---|---|---|
| 2024 | $4,816 | $48,861 | $5,366 | $43,495 |
| 2023 | $4,486 | $43,751 | $4,805 | $38,946 |
| 2022 | $4,486 | $45,942 | $6,855 | $39,087 |
| 2021 | $4,135 | $42,868 | $6,396 | $36,472 |
| 2020 | $4,040 | $41,684 | $6,219 | $35,465 |
| 2019 | $4,085 | $39,862 | $5,947 | $33,915 |
| 2018 | $3,727 | $37,611 | $6,043 | $31,568 |
| 2017 | $3,682 | $35,800 | $5,752 | $30,048 |
| 2016 | $3,575 | $34,549 | $5,551 | $28,998 |
| 2015 | $3,480 | $33,670 | $5,410 | $28,260 |
| 2014 | $3,301 | $33,696 | $8,644 | $25,052 |
| 2012 | $3,307 | $35,015 | $8,644 | $26,371 |
Source: Public Records
Map
Nearby Homes
- 587 Phillips Cir
- 465 Poplar Ave
- 380 Johelia Trail
- 770 Anita Ave
- 290 Oakwood Dr
- 315 Oakwood Dr
- 45 W Vandermeer Dr
- 39 W Vandermeer Dr Unit 3
- 324 Elmwood Ln
- 56 Burnette Dr
- 12719 234th Ave
- 68 Burnette Dr
- 188 Oakwood Dr
- 152 E Depot St
- 52 Burnette Dr
- 45 Van Dyke Dr
- 49 Burnette Dr
- 44 Burnette Dr
- 0 Anita Ave Unit MRD12354735
- 144 Oakwood Dr
Your Personal Tour Guide
Ask me questions while you tour the home.