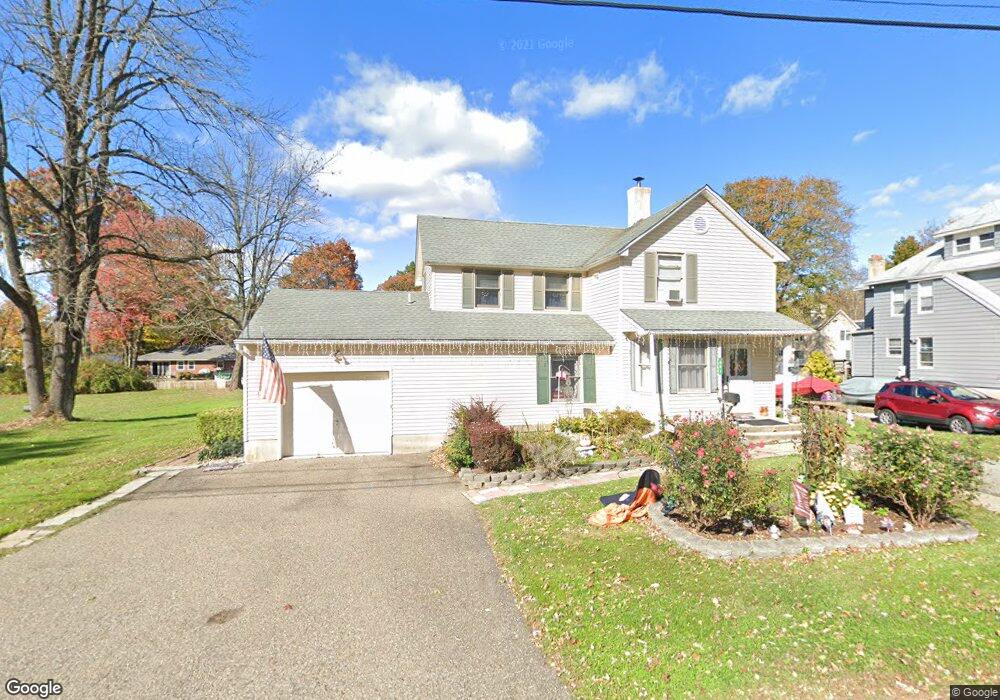
581 Main St Landing, NJ 07850
Estimated Value: $404,000 - $614,000
Studio
--
Bath
1,905
Sq Ft
$265/Sq Ft
Est. Value
About This Home
This home is located at 581 Main St, Landing, NJ 07850 and is currently estimated at $503,901, approximately $264 per square foot. 581 Main St is a home located in Morris County with nearby schools including Eisenhower Middle School, Lincoln Roosevelt Elementary School, and Roxbury High School.
Ownership History
Date
Name
Owned For
Owner Type
Purchase Details
Closed on
Jun 29, 2010
Sold by
Turner Sara A
Bought by
Blaskopf Robert P and Blaskopf Joan E
Current Estimated Value
Home Financials for this Owner
Home Financials are based on the most recent Mortgage that was taken out on this home.
Original Mortgage
$172,000
Outstanding Balance
$114,639
Interest Rate
4.78%
Mortgage Type
Stand Alone First
Estimated Equity
$389,262
Create a Home Valuation Report for This Property
The Home Valuation Report is an in-depth analysis detailing your home's value as well as a comparison with similar homes in the area
Home Values in the Area
Average Home Value in this Area
Purchase History
| Date | Buyer | Sale Price | Title Company |
|---|---|---|---|
| Blaskopf Robert P | $260,000 | New Jersey Title Ins Co |
Source: Public Records
Mortgage History
| Date | Status | Borrower | Loan Amount |
|---|---|---|---|
| Open | Blaskopf Robert P | $172,000 |
Source: Public Records
Tax History
| Year | Tax Paid | Tax Assessment Tax Assessment Total Assessment is a certain percentage of the fair market value that is determined by local assessors to be the total taxable value of land and additions on the property. | Land | Improvement |
|---|---|---|---|---|
| 2025 | $7,983 | $290,400 | $81,600 | $208,800 |
| 2024 | $7,858 | $290,400 | $81,600 | $208,800 |
Source: Public Records
Map
Nearby Homes
Your Personal Tour Guide
Ask me questions while you tour the home.