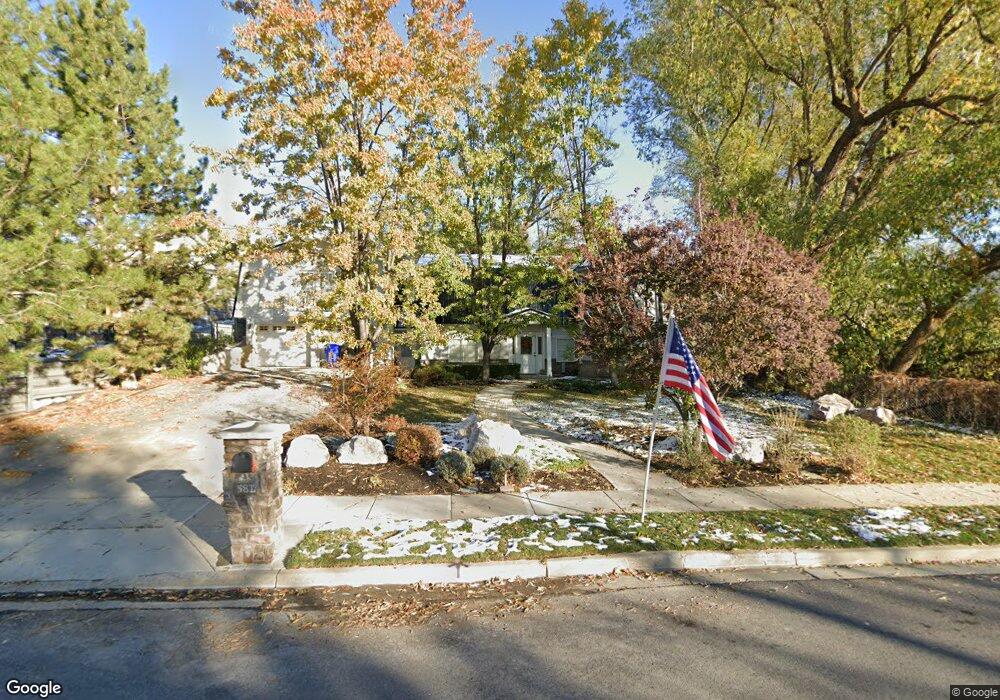
581 S 750 E Bountiful, UT 84010
Estimated Value: $675,591 - $771,000
3
Beds
3
Baths
2,453
Sq Ft
$296/Sq Ft
Est. Value
About This Home
This home is located at 581 S 750 E, Bountiful, UT 84010 and is currently estimated at $724,898, approximately $295 per square foot. 581 S 750 E is a home located in Davis County with nearby schools including Oak Hills School, Millcreek Junior High School, and Bountiful High School.
Ownership History
Date
Name
Owned For
Owner Type
Purchase Details
Closed on
May 23, 2002
Sold by
Wynn G Brent
Bought by
Liston Bety B
Current Estimated Value
Home Financials for this Owner
Home Financials are based on the most recent Mortgage that was taken out on this home.
Original Mortgage
$145,000
Outstanding Balance
$61,271
Interest Rate
6.94%
Estimated Equity
$663,627
Purchase Details
Closed on
Apr 10, 1998
Sold by
Burton Hubert C and Burton Elaine N
Bought by
Wynn G Brent
Purchase Details
Closed on
Feb 18, 1998
Sold by
Burton Elaine N
Bought by
Wynn G Brent
Create a Home Valuation Report for This Property
The Home Valuation Report is an in-depth analysis detailing your home's value as well as a comparison with similar homes in the area
Purchase History
| Date | Buyer | Sale Price | Title Company |
|---|---|---|---|
| Liston Bety B | -- | United Title Services | |
| Wynn G Brent | -- | Bonneville Title Company Inc | |
| Wynn G Brent | -- | Weber Title Company |
Source: Public Records
Mortgage History
| Date | Status | Borrower | Loan Amount |
|---|---|---|---|
| Open | Liston Bety B | $145,000 |
Source: Public Records
Tax History
| Year | Tax Paid | Tax Assessment Tax Assessment Total Assessment is a certain percentage of the fair market value that is determined by local assessors to be the total taxable value of land and additions on the property. | Land | Improvement |
|---|---|---|---|---|
| 2025 | $3,593 | $327,800 | $140,770 | $187,030 |
| 2024 | $3,325 | $313,500 | $128,402 | $185,098 |
| 2023 | $3,220 | $551,000 | $233,811 | $317,189 |
| 2022 | $3,281 | $308,000 | $127,027 | $180,973 |
| 2021 | $3,188 | $460,000 | $166,347 | $293,653 |
| 2020 | $2,805 | $406,000 | $141,105 | $264,895 |
| 2019 | $2,762 | $390,000 | $142,442 | $247,558 |
| 2018 | $2,745 | $383,000 | $139,480 | $243,520 |
| 2016 | $2,312 | $174,350 | $57,073 | $117,277 |
| 2015 | $2,442 | $174,790 | $57,073 | $117,717 |
| 2014 | $2,660 | $196,808 | $57,073 | $139,735 |
| 2013 | -- | $178,706 | $57,728 | $120,978 |
Source: Public Records
Map
Nearby Homes
Your Personal Tour Guide
Ask me questions while you tour the home.