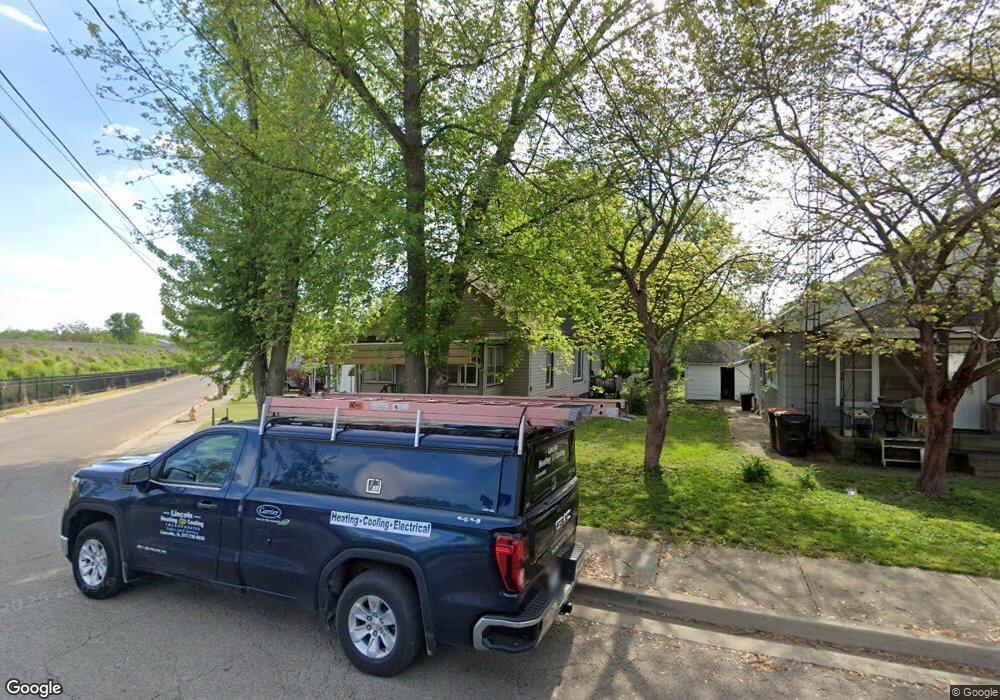
581 S Elm St Lincoln, IL 62656
Estimated Value: $70,159 - $146,000
--
Bed
--
Bath
944
Sq Ft
$99/Sq Ft
Est. Value
About This Home
This home is located at 581 S Elm St, Lincoln, IL 62656 and is currently estimated at $93,790, approximately $99 per square foot. 581 S Elm St is a home located in Logan County with nearby schools including Central Elementary School, Lincoln Junior High School, and Lincoln Community High School.
Ownership History
Date
Name
Owned For
Owner Type
Purchase Details
Closed on
Feb 13, 2019
Sold by
Rademaker Bonita D
Bought by
Klokkenga Erica M
Current Estimated Value
Home Financials for this Owner
Home Financials are based on the most recent Mortgage that was taken out on this home.
Original Mortgage
$36,860
Outstanding Balance
$32,327
Interest Rate
4.38%
Mortgage Type
New Conventional
Estimated Equity
$61,463
Purchase Details
Closed on
Jan 23, 1998
Bought by
Rademaker Bonita D
Create a Home Valuation Report for This Property
The Home Valuation Report is an in-depth analysis detailing your home's value as well as a comparison with similar homes in the area
Home Values in the Area
Average Home Value in this Area
Purchase History
| Date | Buyer | Sale Price | Title Company |
|---|---|---|---|
| Klokkenga Erica M | $38,000 | None Available | |
| Rademaker Bonita D | $37,500 | -- |
Source: Public Records
Mortgage History
| Date | Status | Borrower | Loan Amount |
|---|---|---|---|
| Open | Klokkenga Erica M | $36,860 |
Source: Public Records
Tax History Compared to Growth
Tax History
| Year | Tax Paid | Tax Assessment Tax Assessment Total Assessment is a certain percentage of the fair market value that is determined by local assessors to be the total taxable value of land and additions on the property. | Land | Improvement |
|---|---|---|---|---|
| 2024 | $1,291 | $20,270 | $4,180 | $16,090 |
| 2023 | $1,191 | $18,770 | $3,870 | $14,900 |
| 2022 | $1,118 | $17,500 | $3,610 | $13,890 |
| 2021 | $1,059 | $16,850 | $3,480 | $13,370 |
| 2020 | $1,061 | $16,850 | $3,480 | $13,370 |
| 2019 | $1,027 | $16,520 | $3,410 | $13,110 |
| 2018 | $1,571 | $15,890 | $3,280 | $12,610 |
| 2017 | $1,563 | $15,890 | $3,280 | $12,610 |
| 2016 | $1,542 | $16,080 | $3,320 | $12,760 |
| 2015 | $1,446 | $15,460 | $3,200 | $12,260 |
| 2014 | $1,446 | $15,460 | $3,200 | $12,260 |
| 2013 | $1,446 | $14,260 | $2,950 | $11,310 |
| 2012 | $1,446 | $14,470 | $2,990 | $11,480 |
Source: Public Records
Map
Nearby Homes