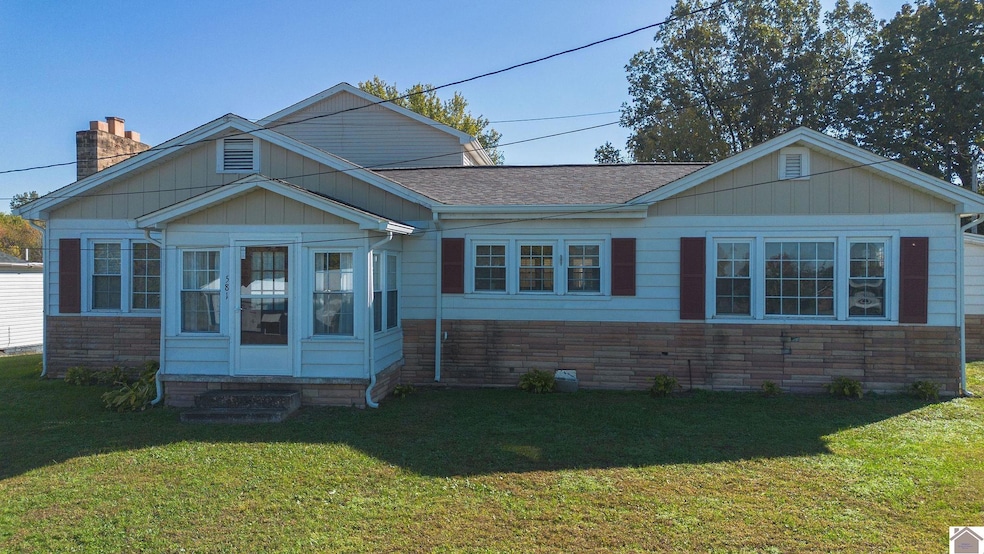
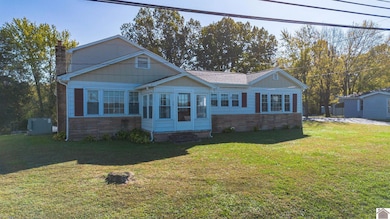
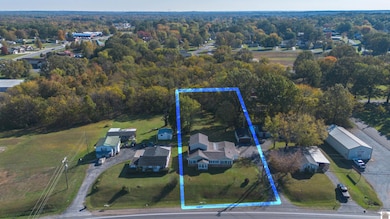
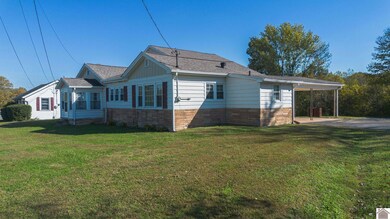

581 S Main St Calvert City, KY 42029
Estimated payment $1,095/month
Highlights
- Very Popular Property
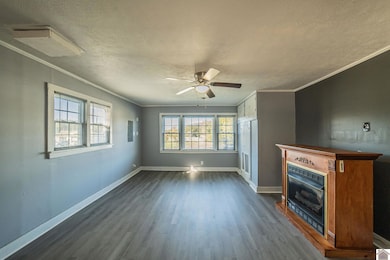
- Family Room with Fireplace
- Breakfast Area or Nook
- North Marshall Middle School Rated 9+
- Wood Flooring
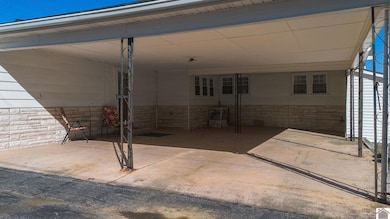
- 2 Car Garage
About This Home
Need lots of room on a budget? A huge back yard? A convenient location? Two separate living spaces? Look no further, this one will check all those boxes! There is so much flexible space to make this home fit your family's needs. Want a large primary suite? Consider converting the two upstairs bedrooms (Seller states the wall in between is not load-bearing) and the half bath into a full ensuite bath for your own primary suite. Or, put the kiddos upstairs where they'll enjoy the great play space at the top of the stairs. The home is totally liveable as it is, but you can put your own stamp on it as you go! Did I mention the new roof in 2024?
Home Details
Home Type
- Single Family
Est. Annual Taxes
- $608
Year Built
- Built in 1952
Lot Details
- 0.58 Acre Lot
- Lot Dimensions are 75' x 239.74'
- Lot Has A Rolling Slope
- Landscaped with Trees
Home Design
- Block Foundation
- Frame Construction
- Composition Shingle Roof
- Vinyl Siding
Interior Spaces
- 2-Story Property
- Ceiling Fan
- Thermal Pane Windows
- Vinyl Clad Windows
- Family Room with Fireplace
- Living Room with Fireplace
- Combination Dining and Living Room
- Utility Room
Kitchen
- Breakfast Area or Nook
- Built-In Oven
- Dishwasher
Flooring
- Wood
- Carpet
Bedrooms and Bathrooms
- 5 Bedrooms
Laundry
- Laundry in Utility Room
- Washer and Dryer Hookup
Unfinished Basement
- Walk-Out Basement
- Partial Basement
- Interior Basement Entry
- Crawl Space
Parking
- 2 Car Garage
- 2 Carport Spaces
- Driveway
Utilities
- Forced Air Heating and Cooling System
- Heating System Uses Gas
- Heating System Uses Natural Gas
- Natural Gas Water Heater
- Cable TV Available
Map
Home Values in the Area
Average Home Value in this Area
Tax History
| Year | Tax Paid | Tax Assessment Tax Assessment Total Assessment is a certain percentage of the fair market value that is determined by local assessors to be the total taxable value of land and additions on the property. | Land | Improvement |
|---|---|---|---|---|
| 2024 | $608 | $73,000 | $8,000 | $65,000 |
| 2023 | $631 | $73,000 | $8,000 | $65,000 |
| 2022 | $658 | $73,000 | $8,000 | $65,000 |
| 2021 | $524 | $57,500 | $8,000 | $49,500 |
| 2020 | $528 | $57,500 | $8,000 | $49,500 |
| 2019 | $527 | $57,500 | $8,000 | $49,500 |
| 2018 | $529 | $57,500 | $8,000 | $49,500 |
| 2017 | $529 | $57,500 | $8,000 | $49,500 |
| 2016 | $184 | $20,000 | $8,000 | $12,000 |
| 2015 | $185 | $20,000 | $8,000 | $12,000 |
| 2014 | $185 | $20,000 | $0 | $0 |
| 2010 | -- | $73,000 | $21,000 | $52,000 |
Property History
| Date | Event | Price | List to Sale | Price per Sq Ft |
|---|---|---|---|---|
| 10/31/2025 10/31/25 | For Sale | $199,000 | -- | $69 / Sq Ft |
Purchase History
| Date | Type | Sale Price | Title Company |
|---|---|---|---|
| Deed | $52,300 | Blankenship & Edwards Law Offi | |
| Commissioners Deed | -- | None Available |
Mortgage History
| Date | Status | Loan Amount | Loan Type |
|---|---|---|---|
| Previous Owner | $37,369 | Purchase Money Mortgage |
Source: Western Kentucky Regional MLS
MLS Number: 134515
APN: 0C-05-03-005.010000
Disclaimer: Certain information contained herein is derived from information provided by parties other than Homes.com. All information provided is deemed reliable, but is not guaranteed to be accurate and should be independently verified.
![]() IDX information is provided exclusively for personal, non-commercial use, and may not be used for any purpose other than to identify prospective properties consumers may be interested in purchasing. Information is deemed reliable but not guaranteed.
IDX information is provided exclusively for personal, non-commercial use, and may not be used for any purpose other than to identify prospective properties consumers may be interested in purchasing. Information is deemed reliable but not guaranteed.
- 587 S Main St Unit 583 S Main St
- 271 E 3rd Ave
- 574 Fern Cir
- 43 2nd Ave SE
- 771 Chestnut St
- 00 Pine St
- 0000 Prince John Way
- 78 Ash St
- 59 Aspen St
- 647 Elder St
- 576 Hickory St
- 808 Oak Park Blvd
- Lot 7 Edison Dr
- 000 Quail Rd Unit Oaklawn Lane
- 359 Ironwood Dr
- 4300 U S 62
- 1740 Colorado St
- 300 Scillion Dr
- 000 Lone Valley Rd
- Lot 24 Ford Square Dr
- 67 Country Club Ln
- 151 Henry Sledd Rd Unit A
- 2216 Dyke Rd
- 107 Molloy Ct
- 103 Molloy Ct
- 5833 Benton Rd Unit 2
- 2150 Irvin Cobb Dr
- 430 Adams St
- 111 Market House Square Unit 201
- 219 Broadway St
- 229 Broadway St Unit 301
- 525 Broadway St
- 820 Washington St
- 520 Madison St
- 411 N 7th St Unit 1
- 815 Monroe St
- 1107 Markham Ave
- 1008 Martin Luther King jr Dr Unit Studio Apartment B
- 326 N 16th St
- 2117 Madison St
