Estimated Value: $229,042 - $310,000
2
Beds
2
Baths
1,519
Sq Ft
$183/Sq Ft
Est. Value
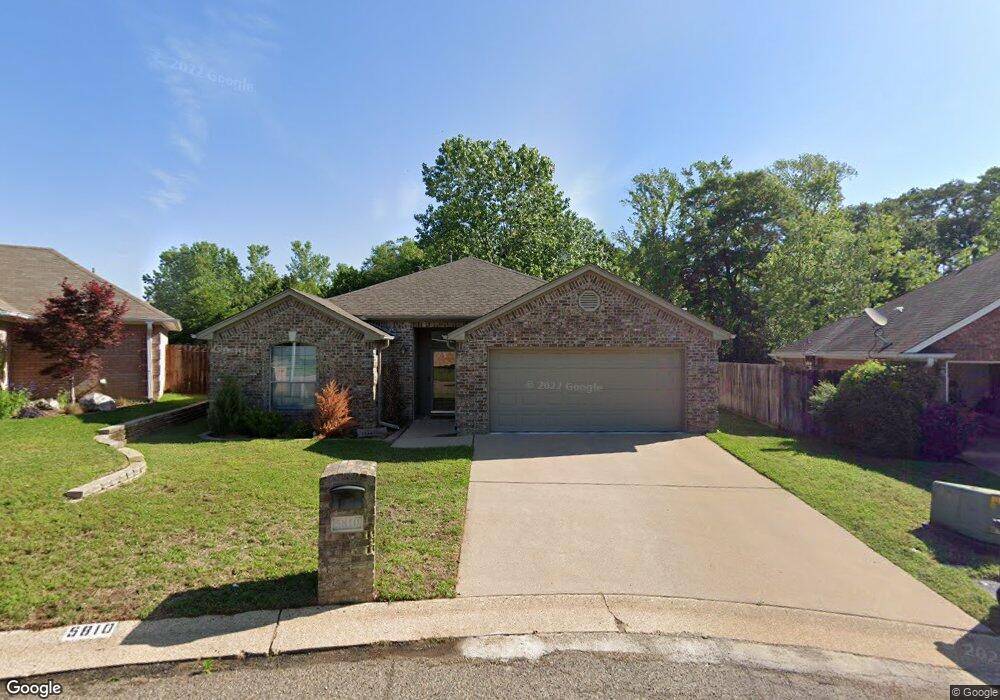
About This Home
This home is located at 5810 5810 Creekside, Tyler, TX 75703 and is currently estimated at $277,511, approximately $182 per square foot. 5810 5810 Creekside is a home located in Smith County with nearby schools including Rice Elementary School, Hubbard Middle School, and Tyler Legacy High School.
Ownership History
Date
Name
Owned For
Owner Type
Purchase Details
Closed on
May 16, 2019
Sold by
Saleh Patricia Ann
Bought by
Knight Denis Kyle
Current Estimated Value
Home Financials for this Owner
Home Financials are based on the most recent Mortgage that was taken out on this home.
Original Mortgage
$119,000
Outstanding Balance
$90,153
Interest Rate
4%
Mortgage Type
Commercial
Estimated Equity
$187,358
Purchase Details
Closed on
May 16, 2014
Sold by
King Betty R
Bought by
Saleh Patricia Ann
Home Financials for this Owner
Home Financials are based on the most recent Mortgage that was taken out on this home.
Original Mortgage
$26,000
Interest Rate
4.46%
Mortgage Type
New Conventional
Purchase Details
Closed on
Sep 30, 2010
Sold by
Penn Terry T and Penn Sheryl A
Bought by
King Betty R
Home Financials for this Owner
Home Financials are based on the most recent Mortgage that was taken out on this home.
Original Mortgage
$85,000
Interest Rate
4.46%
Mortgage Type
New Conventional
Create a Home Valuation Report for This Property
The Home Valuation Report is an in-depth analysis detailing your home's value as well as a comparison with similar homes in the area
Home Values in the Area
Average Home Value in this Area
Purchase History
| Date | Buyer | Sale Price | Title Company |
|---|---|---|---|
| Knight Denis Kyle | -- | None Available | |
| Saleh Patricia Ann | -- | None Available | |
| King Betty R | -- | Ctc | |
| King Betty R | -- | Ctc |
Source: Public Records
Mortgage History
| Date | Status | Borrower | Loan Amount |
|---|---|---|---|
| Open | Knight Denis Kyle | $119,000 | |
| Previous Owner | Saleh Patricia Ann | $26,000 | |
| Previous Owner | King Betty R | $85,000 |
Source: Public Records
Tax History Compared to Growth
Tax History
| Year | Tax Paid | Tax Assessment Tax Assessment Total Assessment is a certain percentage of the fair market value that is determined by local assessors to be the total taxable value of land and additions on the property. | Land | Improvement |
|---|---|---|---|---|
| 2025 | $3,954 | $214,179 | $31,424 | $182,755 |
| 2024 | $3,954 | $232,407 | $31,500 | $200,907 |
| 2023 | $3,912 | $224,444 | $31,500 | $192,944 |
| 2022 | $4,191 | $213,944 | $21,000 | $192,944 |
| 2021 | $3,171 | $151,120 | $21,000 | $130,120 |
| 2020 | $3,263 | $152,489 | $21,000 | $131,489 |
| 2019 | $3,870 | $176,993 | $21,000 | $155,993 |
| 2018 | $3,701 | $170,156 | $21,000 | $149,156 |
| 2017 | $3,633 | $170,156 | $21,000 | $149,156 |
| 2016 | $3,489 | $163,446 | $21,000 | $142,446 |
| 2015 | $2,573 | $158,866 | $21,000 | $137,866 |
| 2014 | $2,573 | $154,261 | $21,000 | $133,261 |
Source: Public Records
Map
Nearby Homes
- 973 Creekside Dr
- 1212 Parkview Dr
- 716 Chimney Rock Dr
- 5900 Stoneleigh Dr
- 5803 Stoneleigh Dr
- 6001 Huntington Dr
- 5701 Plantation Dr
- 5802 Briar Creek Dr
- 709 W Rieck Rd
- 5829 Brynmar Ct
- 5401 Hollytree Dr
- 5401 Hollytree Dr Unit 1002
- 717 Meadow Creek Dr
- 709 Top Hill Dr
- 1869 Hollylake Cir
- 608 Top Hill Dr
- 802 Carriage Dr
- 1915 Hollyglen Dr
- 940 La Vista Dr
- 1202 Rice Rd
- 5810 Creekside Cir
- 5806 Creekside Cir
- 5814 Creekside Cir
- 5740 Hollytree Dr
- 5802 5802 Creekside Cir
- 5802 Creekside Cir
- 5805 Creekside Cir
- 5801 Creekside Cir
- 5730 Hollytree Dr
- 5702 Hollytree Dr
- 5818 Creekside Cir
- 5835 5835 Creekside Dr
- 5835 Creekside Cir
- 5720 Hollytree Dr
- 5822 Creekside Cir
- 5839 Creekside Cir
- 5849 5849 Creekside
- 5849 Creekside Cir
- 5710 Hollytree Dr
- 1202 Parkview Dr