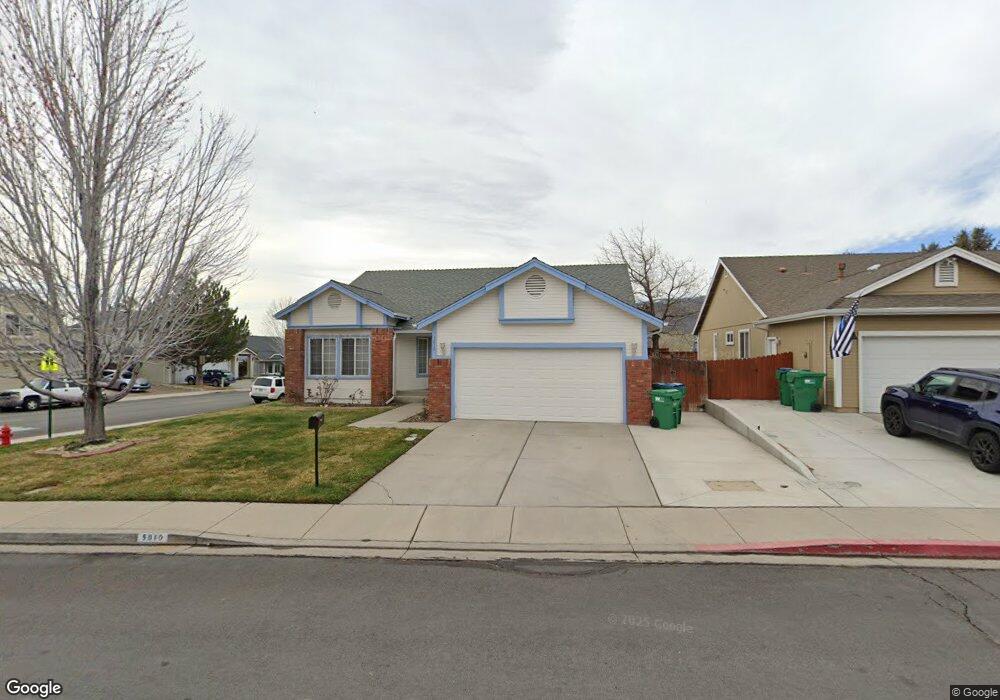
5810 Mitra Way Reno, NV 89523
Mae Anne Avenue NeighborhoodEstimated Value: $544,000 - $615,000
3
Beds
2
Baths
1,699
Sq Ft
$341/Sq Ft
Est. Value
About This Home
This home is located at 5810 Mitra Way, Reno, NV 89523 and is currently estimated at $578,781, approximately $340 per square foot. 5810 Mitra Way is a home located in Washoe County with nearby schools including Sarah Winnemucca Elementary School, B D Billinghurst Middle School, and Robert McQueen High School.
Ownership History
Date
Name
Owned For
Owner Type
Purchase Details
Closed on
Sep 24, 2025
Sold by
Douglas Brian D
Bought by
Hendrickson Matthew Carl
Current Estimated Value
Home Financials for this Owner
Home Financials are based on the most recent Mortgage that was taken out on this home.
Original Mortgage
$380,000
Outstanding Balance
$380,000
Interest Rate
5.71%
Mortgage Type
New Conventional
Estimated Equity
$198,781
Purchase Details
Closed on
Nov 23, 2015
Sold by
Douglas Pauline N
Bought by
Douglas Bing D
Purchase Details
Closed on
Jun 20, 1995
Sold by
Simons/Moore/Frank Ltd Liability Company
Bought by
Douglas Bing D and Douglas Pauline N
Home Financials for this Owner
Home Financials are based on the most recent Mortgage that was taken out on this home.
Original Mortgage
$137,050
Interest Rate
7.88%
Create a Home Valuation Report for This Property
The Home Valuation Report is an in-depth analysis detailing your home's value as well as a comparison with similar homes in the area
Home Values in the Area
Average Home Value in this Area
Purchase History
| Date | Buyer | Sale Price | Title Company |
|---|---|---|---|
| Hendrickson Matthew Carl | $570,000 | First American Title | |
| Douglas Bing D | -- | None Available | |
| Douglas Bing D | $171,500 | First Centennial Title Co |
Source: Public Records
Mortgage History
| Date | Status | Borrower | Loan Amount |
|---|---|---|---|
| Open | Hendrickson Matthew Carl | $380,000 | |
| Previous Owner | Douglas Bing D | $137,050 |
Source: Public Records
Tax History Compared to Growth
Tax History
| Year | Tax Paid | Tax Assessment Tax Assessment Total Assessment is a certain percentage of the fair market value that is determined by local assessors to be the total taxable value of land and additions on the property. | Land | Improvement |
|---|---|---|---|---|
| 2025 | $2,725 | $106,065 | $44,240 | $61,825 |
| 2024 | $2,647 | $103,810 | $41,300 | $62,510 |
| 2023 | $1,921 | $103,214 | $43,855 | $59,359 |
| 2022 | $2,570 | $85,788 | $36,120 | $49,668 |
| 2021 | $2,499 | $74,282 | $24,675 | $49,607 |
| 2020 | $2,412 | $75,157 | $25,795 | $49,362 |
| 2019 | $2,343 | $71,531 | $23,590 | $47,941 |
| 2018 | $2,275 | $64,289 | $17,220 | $47,069 |
| 2017 | $2,208 | $63,358 | $16,065 | $47,293 |
| 2016 | $2,153 | $64,044 | $15,680 | $48,364 |
| 2015 | $2,150 | $61,983 | $13,685 | $48,298 |
| 2014 | $2,089 | $57,759 | $11,060 | $46,699 |
| 2013 | -- | $55,148 | $9,065 | $46,083 |
Source: Public Records
Map
Nearby Homes
- 1500 Backer Way
- 5830 Blue Horizon Dr
- 5870 Blue Horizon Dr
- 5895 Blue Horizon Dr
- 1659 Shadow Park Dr
- 5878 Grand Row Way
- 5882 Grand Row Way Unit Lot 61
- 1627 Prancer St Unit Lot 50
- 1627 Prancer St
- 1615 Prancer St Unit Lot 53
- 1689 Shadow Park Dr
- Walker Plan at Monarch
- Humboldt Plan at Monarch
- 1618 Icelandic Way Unit Lot 67
- 1618 Icelandic Way
- 1626 Icelandic Way
- 1639 Prancer St Unit Lot 47
- 0 Simons Dr
- 5849 Morgan Horse St
- 1708 Kristin Way
- 5820 Mitra Way
- 5830 Mitra Way
- 1438 Backer Way
- 1469 Backer Way
- 1448 Backer Way
- 1428 Backer Way
- 1458 Backer Way
- 5825 Mitra Way
- 1418 Backer Way
- 5840 Mitra Way
- 1479 Backer Way
- 1468 Backer Way
- 1408 Backer Way
- 5835 Mitra Way
- 5850 Mitra Way
- 1519 Lindsay Dr
- 1509 Lindsay Dr
- 1529 Lindsay Dr
- 1478 Backer Way
- 1489 Backer Way